|
iQue Forecyt® Reference Guide (Version 10.0)
|
Add Plate View
 Add Plate View creates thumbnails of every well on the plate. The thumbnails in the grid can be Plots, Histograms, Overlay Histograms and Overlay Plots. These Plate Views can be manipulated, copied to the clipboard, and output to reports.
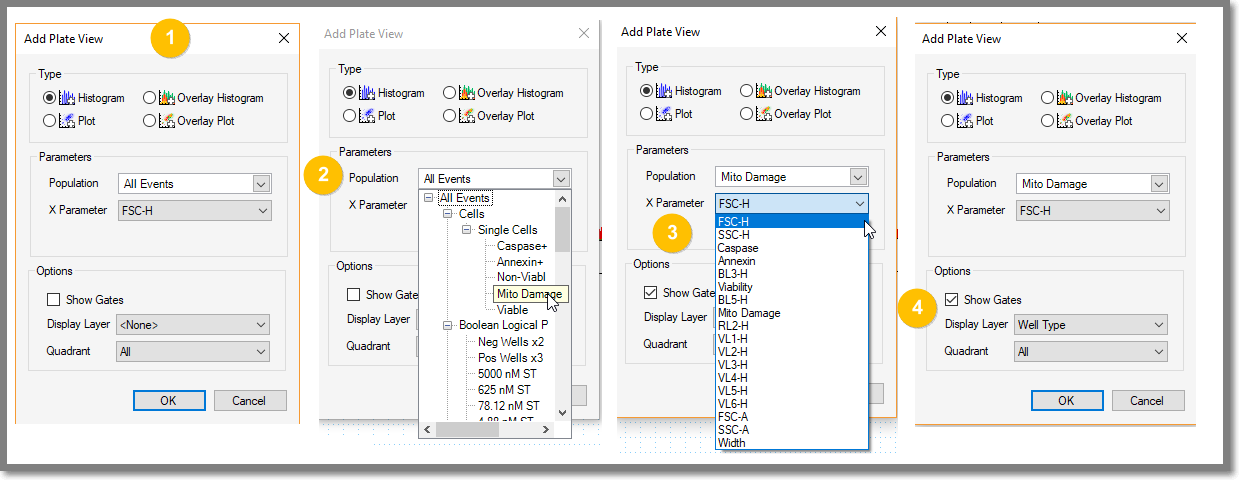
The following screen shot shows the Add Plate View menu (1). In this example, the Type of Plate view Histogram radio button is selected. The Population (2) drop-down lists all the well types on your plate. The X Parameter (3) drop-down is for channel selection. You have the option to Show Gates and specify the Display Layer (4) with a drop-down.
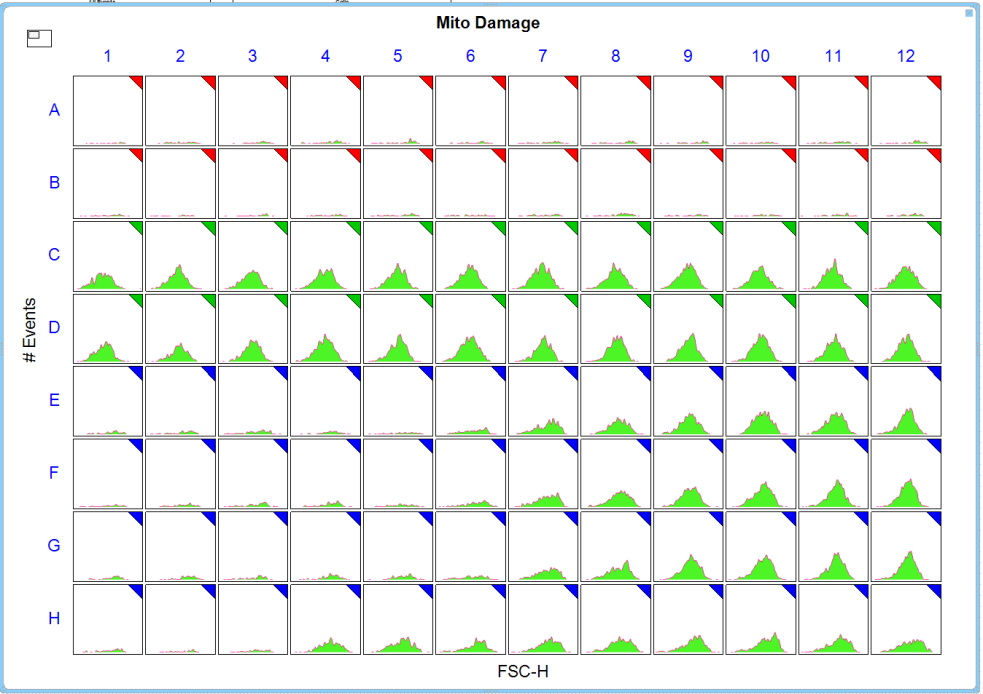
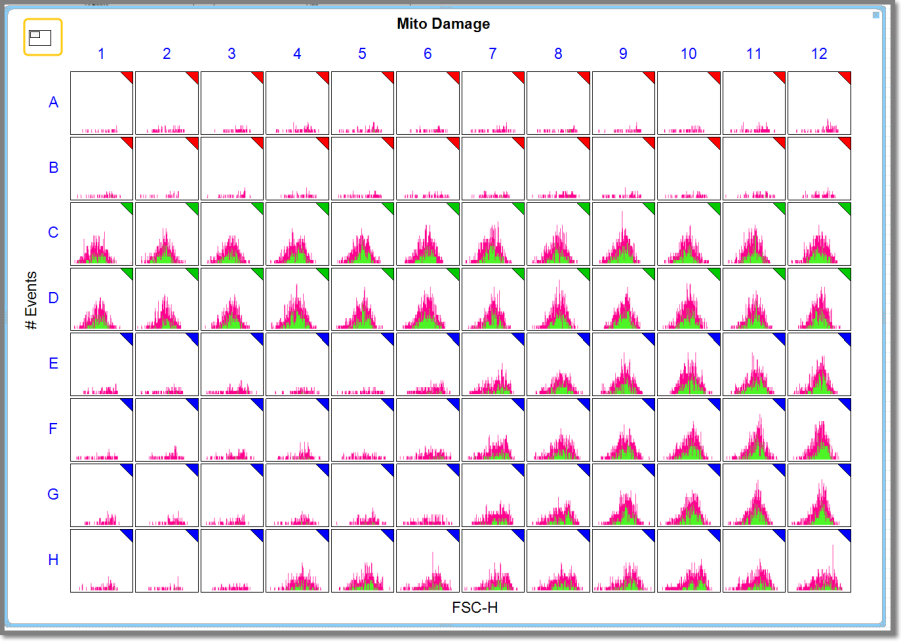
This process applies a histogram to each well of the plate as shown in the following screenshot. The small rectangle in the upper-left corner controls the viewing area of the plate. In this example, we’re seeing the whole plate. The small triangle in the upper-right corner of wells designates wells in which a compound is present.
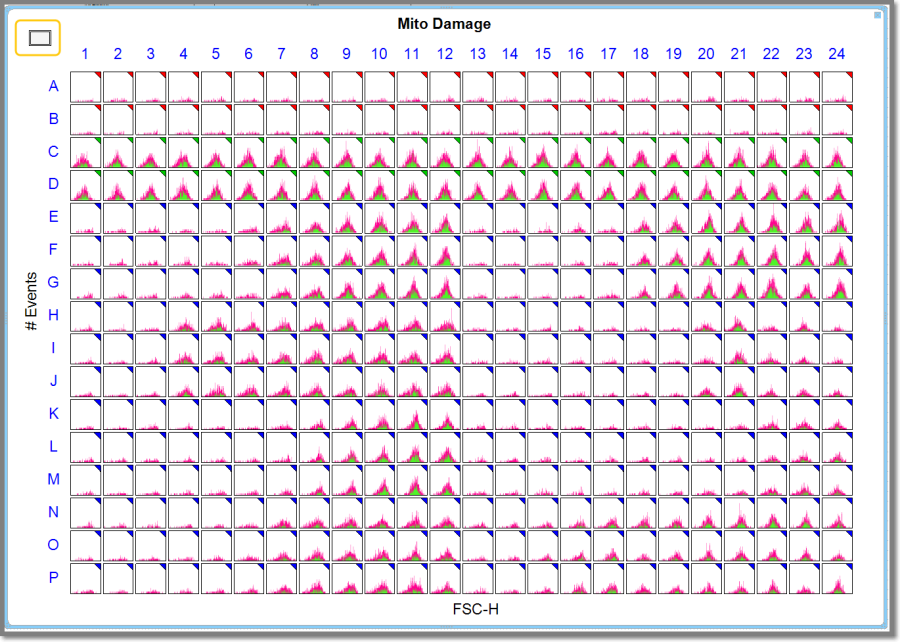
Clicking on a corner of the rectangle selects a specific quadrant to view as shown in the following screenshot. You can continue clicking in each quadrant and when you have clicked all four, the histogram resets to show all wells. In the following screenshot, the upper left quadrant is selected.
Style: Plate View
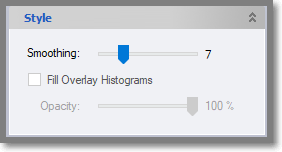
The Style pane and Smoothing slider allows you to adjust the granularity of the histograms. The following example demonstrates how smoothing makes the Plate View histogram easier to interpret.