
|
iQue Forecyt® Reference Guide (Version 10.0)
|
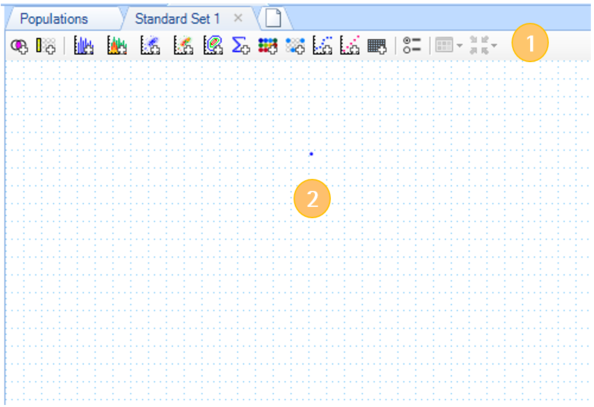
Analysis Toolbar and Workspace
You can add Analyses with the tool bar (1) The screenshot above shows the basic default tool bar. Other contextual tools, such as gating, are enabled in relation to the selected analysis. You can use the tools to populate the Workspace (2). The Analysis workspace is where you will develop and arrange all your analytical functions such as Heat Maps, Dose Response Curves, and Statistics panels. The entire Workspace updates in real time. When you update one analysis on the workspace the other analyses update to reflect the change.
Icon Legend

|
Boolean Logical Population |

|
Standard Curve |

|
Well-Based Boolean Logic |

|
Plate View |

|
Histogram |

|
Zoom/Select |

|
Overlay Histogram |

|
Polygonal, Rectangular and Regional Gating Tools |

|
Plot |

|
Redo/Undo Gate Edit |

|
Overlay Plot |

|
Switch Axes |

|
Contour Plot |

|
Well Scan: Checked for plots and histograms= data from a specific well. Unchecked= accumulated data from entire plate |

|
Statistics |

|
Layout Select Charts |

|
Heat Map |

|
Analysis Mode Settings: Biexponential scale settings (automatic or manual override) |

|
Profile Map |

|
Resize select charts |

|
Dose Response Curve |

|
Lightweight Mode |