|
iQue Forecyt® Reference Guide (Version 10.0)
|
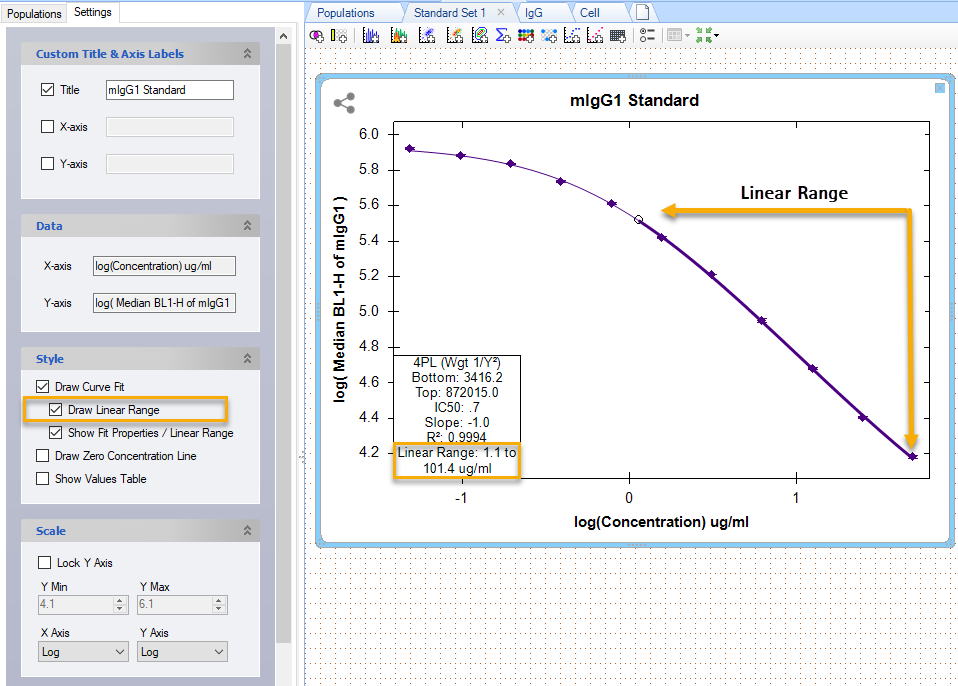
Draw Linear Range: Standard Curve
When you select Draw Linear Range, an overlay line on the Curve Fit marks the linear range, as shown in the following screenshot. The circles mark each end. If you select Show Point Values: Standard Curve in the Right-Click context menu and then hover the tooltip you can see the values.