|
iQue Forecyt® Reference Guide (Version 10.0)
|
Heat Maps: Panorama

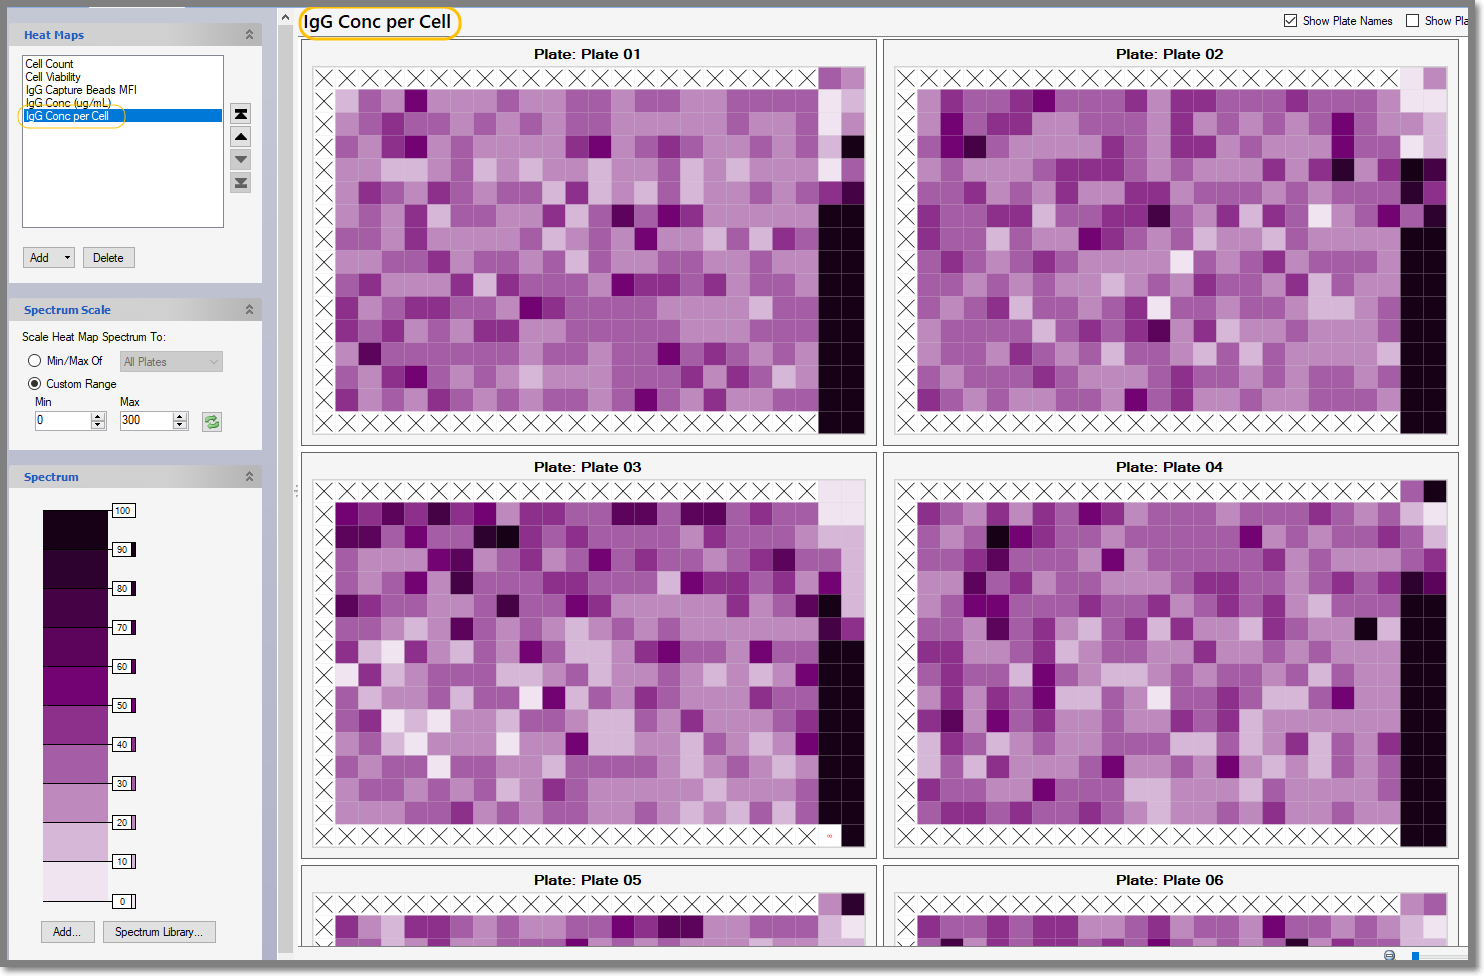
The Heat Maps tab lets you see a tiled grid of heat maps across all plates of an experiment. This provides a high-level overview of all the samples on one screen.
Note: Any Heat Maps you create in Panorama, or , Heat Maps created in iQue Forecyt® and modified in Panorama, will NOT propagate back to iQue Forecyt®. All changes remain local in Panorama.
When you select a Metric in the Heat Map pane—the IgG Concentration per Cell in the following screenshot—you’ll see tiled Heat Maps displayed in the workspace.
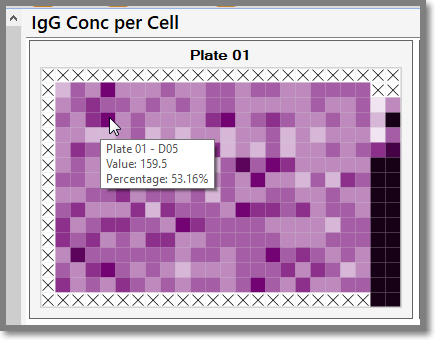
You can hover the tool tip over any well in the Heat Map to display information about that well, as shown in the following screenshot.