|
iQue Forecyt® Reference Guide (Version 10.0)
|
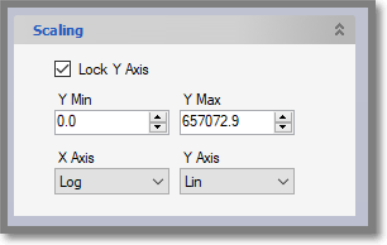
Scaling
When you select a Series graph the Scaling pane updates to include the Scale settings. These settings are unique for each Series graph. By default, the Y axis is locked to a range from the minimum to maximum points of the graph. The default X Axis scaling is Log and the default Y Axis scaling is Lin. When locked, the Y-Axis for all plots in the Series Graph can be set to the minimum and maximum in the Y-Min and Y-Max fields.
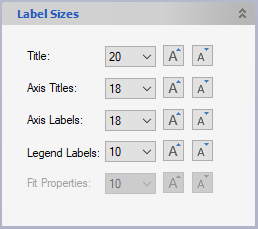
Label Sizing
While viewing data in the Series tab in Panorama, you may change the text sizes on graphs using the Label Sizes settings at the lower left hand side of the page (you may need to scroll down to see this option). You can modify size of the title, axes titles, axis labels, legend labels and fit properties for the text in a graph(s) or series by entering the numerical sizes or clicking the increase or decrease buttons on the right. The label sizing for fit properties can be adjusted when you enable the show the fit properties, found under the "style for all" features option.