|
iQue Forecyt® Reference Guide (Version 10.0)
|
Single Graph View
As show in the following screenshot, View by Single Graph displays the selected Plate and Series in a single graph for both Line and Bar rendering modes.
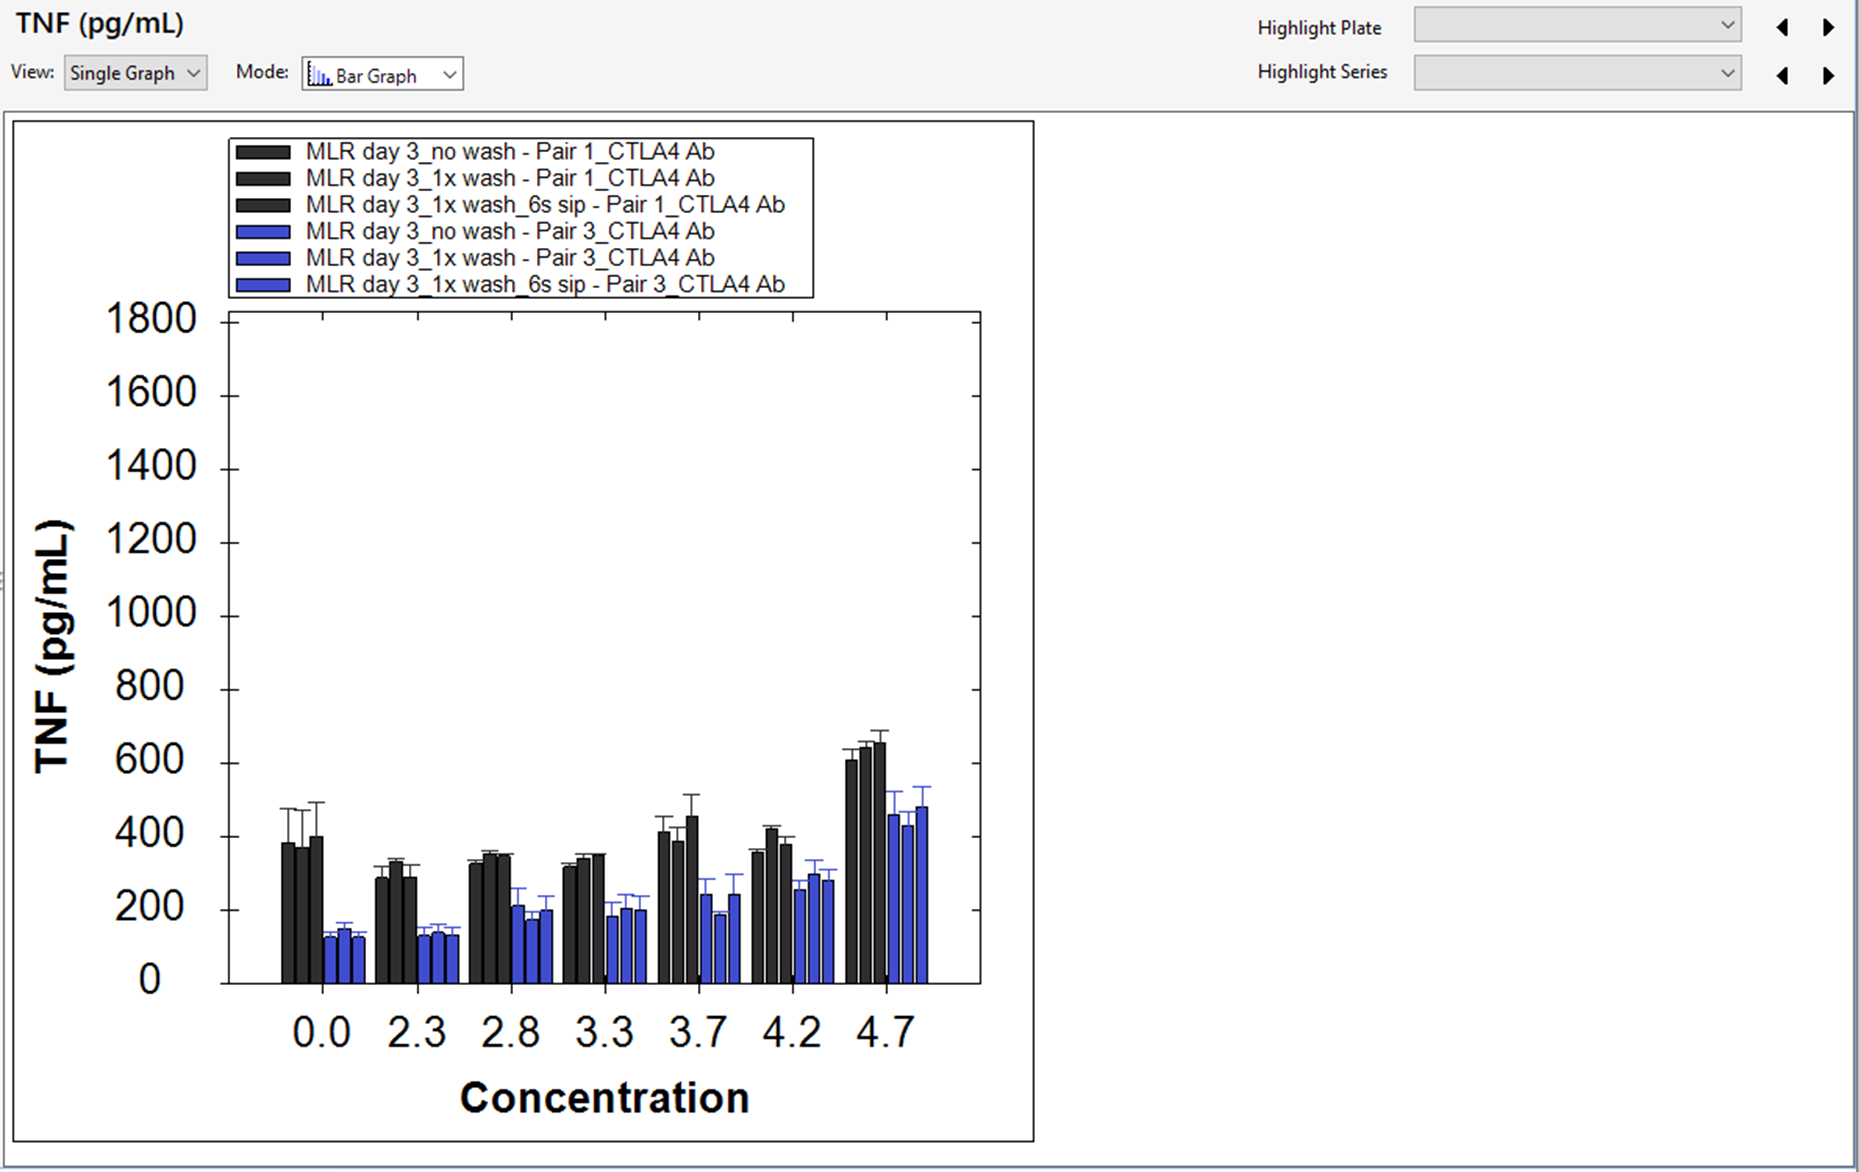
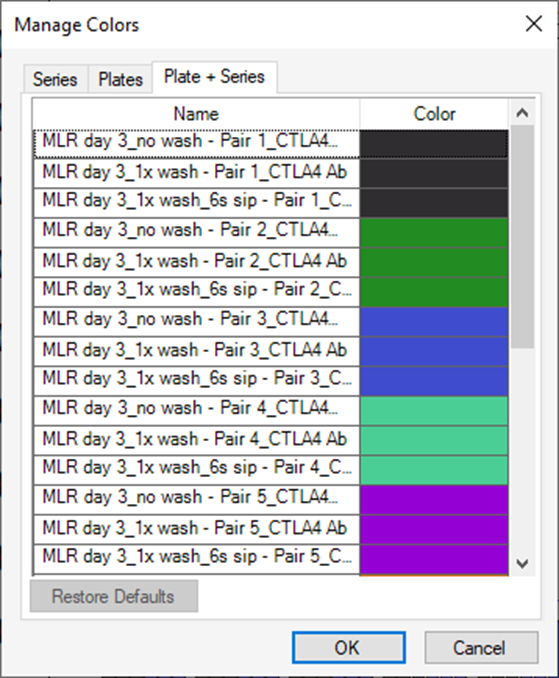
Note that the bars and lines default to their default colors. To distinguish between the Plate/Series combinations, press the Manage Colors dialog and assign custom colors on the Plate + Series tab.