|
iQue Forecyt® Reference Guide (Version 10.0)
|
Standard Curve Right-click Functions
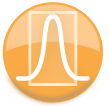
The right-click menu provides another access point for the functions described in Dose Response Settings Sidebar : Draw Curve Fit, Show Fit Properties, Draw Linear Range, Show Values Table, Draw Zero Concentration Line. In addition, it has specific Standard Curve-related functions: Fit Using Individual Points, Draw Individual Points, Export Fit Values, Share Fit in Analysis/Update Shared Fit and Show Point Values.
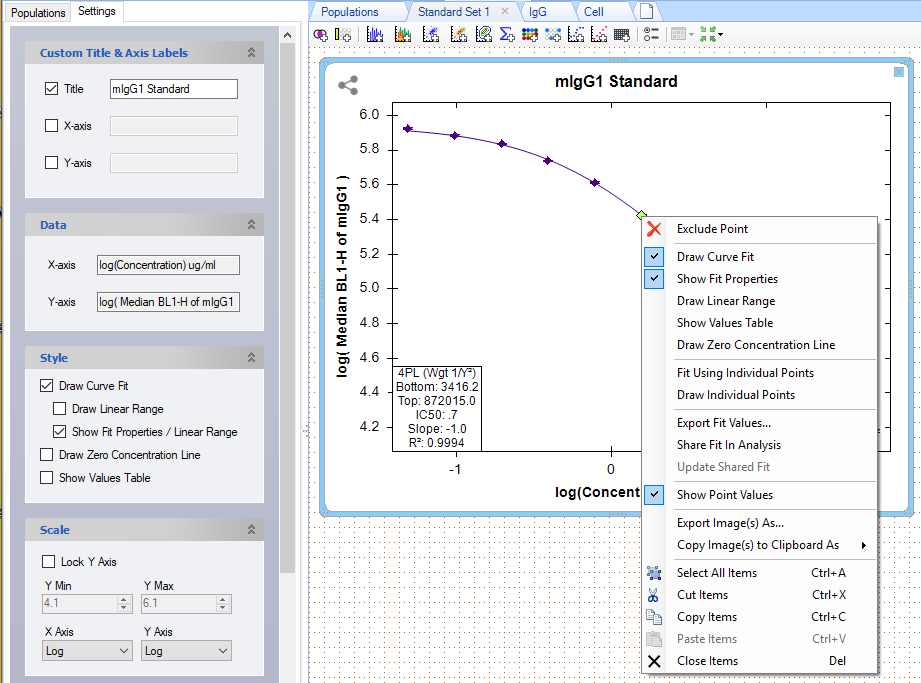
Exclude Point: Standard Curve
Exclude Point is a right-click function that is only visible when you hover the tool tip directly over a point. If you have an outlier point, hover the tool it until it changes color and right-click to enable the Exclude Point option.
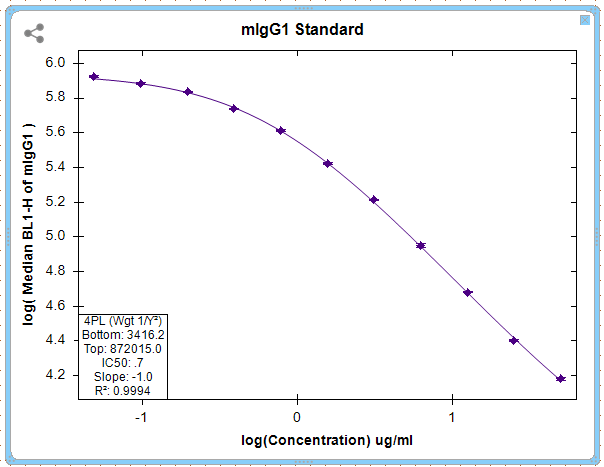
Fit Using Individual Points/Draw Individual Points: Standard Curve
If the graph includes replicates, you can Fit Using Individual Points and Draw Individual Points. Rather than a single point at each dose, there are the individual replicate points (and no error bars). These functions are only enabled if there are replicates.
The following screenshot shows Fit Using Individual Points and Draw Individual Points enabled.
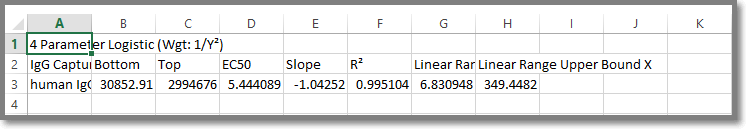
Export Fit Values Standard Curve
Export Fit Values exports a .csv file to a location you specify in the window that opens. The output will look something like this:
Share Fit in Analysis/Update Shared Fit
This is another access point to access to update and Share Curve Fits. The Share Fit in Analysis right-click menu item allows you to make a Standard Curve Fit available for calculating concentrations on other plates in you experiment. When you click on it, this message is displayed:
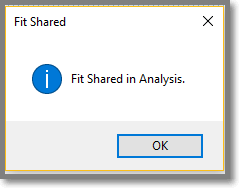
Share Fit in Analysis is only enabled if the curve fit exists and is not shared. The Update Shared Fit menu item allows you to update the shared fit with the current curve fit settings. This option is enabled if the curve fit is shared, but is currently out of date and does not match the current curve fit.
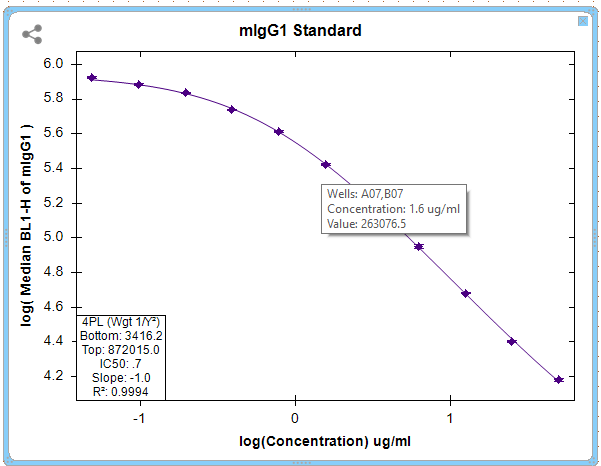
Show Point Values: Standard Curve
When Show Point Values is checked, you can hover the tool tip over a point to see the values, as shown in the following screenshot.