|
iQue Forecyt® Reference Guide (Version 10.0)
|
Label Sizes
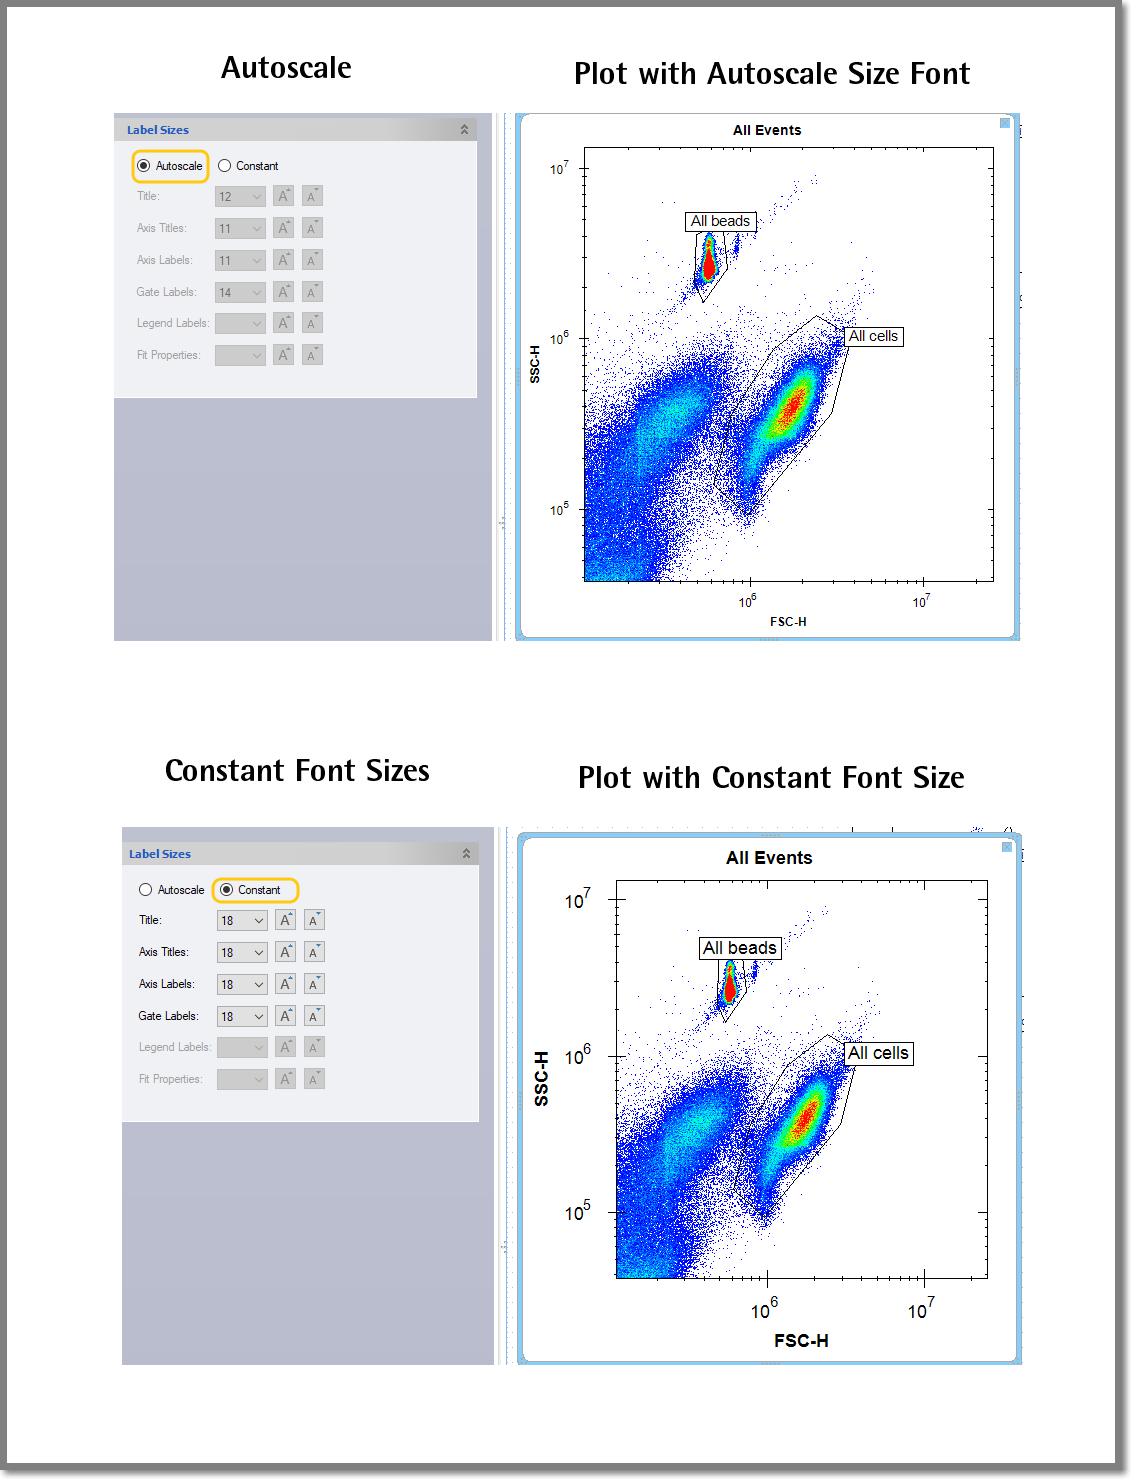
Label Sizes allows you to control the label sizes so that you can enlarge them for use in presentations, the lab notebook or other displays. There are two radio buttons, Autoscale and Constant, that control whether the target (i.e. the currently selected layout panel item in the Analysis view) should auto scale based on the size of the graph, or, specify a constant font size. Auto size is enabled by default.
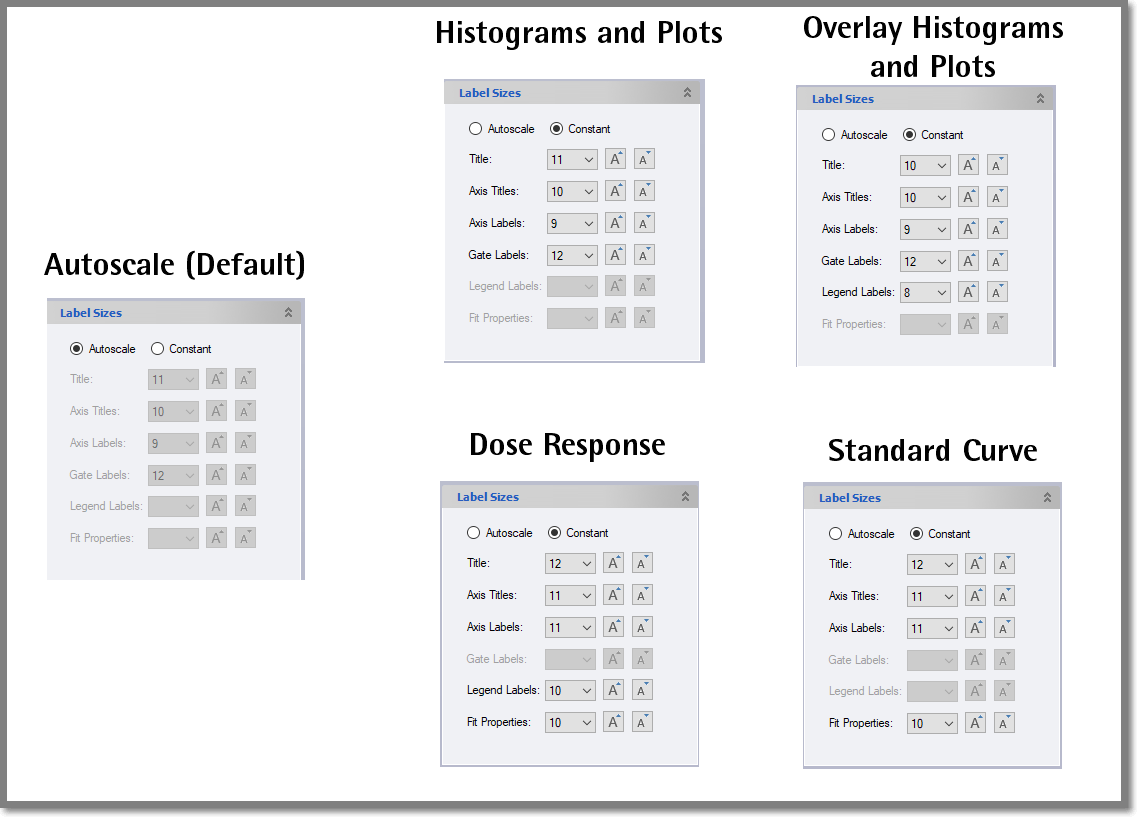
The following screenshots show all possible Label Size configurations.
When you click on the Constant radio button, the re-sizable features are enabled. There are drop-down boxes to select different font sizes (from 8 to 36 point). The icons bump the font up or down one size from the size displayed in the drop-down.
The following features are re-sizeable:
• Title
The main title at the top of the window. For layout panel items where the Title is optional (Dose Response graphs or Standard Curve graphs) the Title combo box is still enabled and sets a constant font size, which will be used if you decide to add a title later.
• Axis Titles
These are the titles for the X and Y axis. The titles do not automatically apply an ellipsis (“...” appended to text that is clipped outside of the graph).
• Axis Labels
These are the labels for the values along the X and Y axis. The Major tick marks on the axis are sized relative to this Axis Labels size, so larger labels will have larger Major tick marks.
• Gate Labels
This label size applies to all the gate labels in the graph, including region gates and their four percentage labels. If the layout panel item does not support gates, like Dose Response Graphs and Standard Curves, the Gate Labels controls will be disabled.
• Legend Labels
This controls the label sizes for the Legend, if applicable and visible. The keys (legend symbols) scale with the Legend Labels size.
• Fit Properties
This label size only applies to the curve fit properties of Dose Response graphs and Standard Curve graphs, regardless of whether it is visible or not.
The following screenshots show font size increases on plot labels. Notice how the external size of the plot doesn't change; rather, the actual plot size is reduced to accommodate the larger labels.