|
ForeCyt Reference Guide (Version 8.1)
|
Analysis Sidebar: Populations
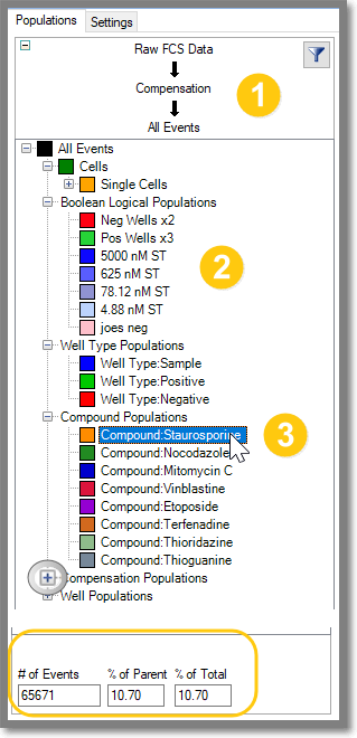
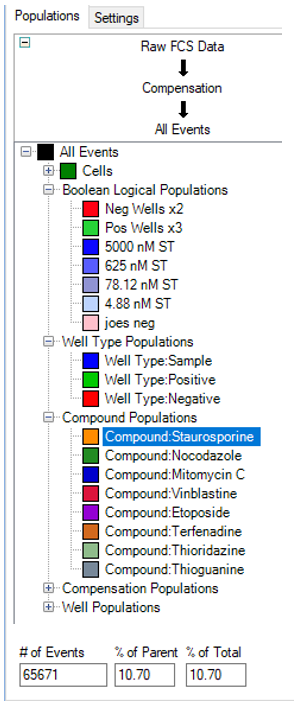
The Populations sidebar is a tree hierarchy of all the Populations in your experiment. At the top is the (1) FCS Pipeline. There are a variety of Populations (2), including (3) Boolean Logical Population. Clicking on a population in the Population Tree—in this example, Staurosporin —shows the # of Events, % of Parent and % of Total at the bottom of the pane. (3) Clicking on the small plus sign (+ shown in the magnifying circle) next to each population expands the population.
Analysis Sidebar Populations Right-Click
The following screenshots show the right-click functions associated with the Analysis Sidebar. Select a population with a left-click (1) then right-click (2) for functions that allow you to add a Histogram, Plot, Overlay Plot, Show Backgate or Export Population Data. (3) If you select a Boolean Logical Population and then right-click , a more extensive menu appears.
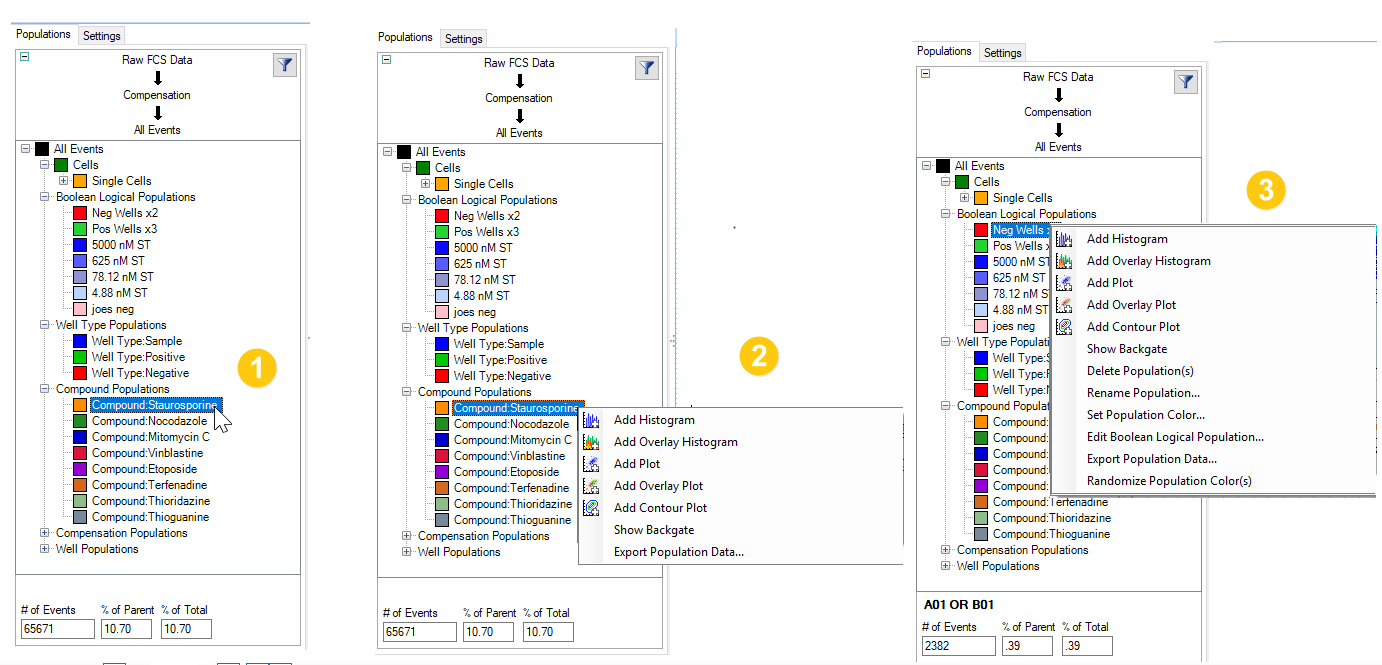
Add Histogram, Add Plot, Add Overlay Histogram, Add Overlay Plot, Add Contour Plot – Create a default plot or histogram of the specified type with the selected population as the input.
Show Backgate – Backgating provides a quick way to create overlay populations to validate or explore the location of a gated population.
Delete Population(s) – Delete the selected populations.
Rename Population – Change the name of the population.
Set Population Color – Change the color the of the population
Edit Well Based Boolean Logical Population— Select specific wells to modify a Boolean Logical Population
Export Population Data – This will export all events and the parameter values that are loaded as a space separated text file for external analysis.
Randomize Population Color(s) – This will change the color of all the selected populations to a new, random color.
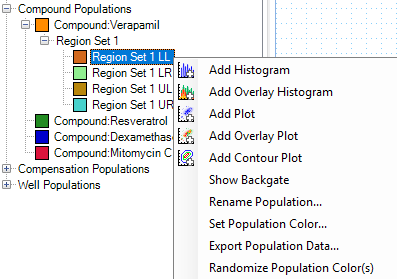
If your Population tree includes a Region Set (Region Gate in a Plot) there are specific right-click functions, as shown in the following screenshot.
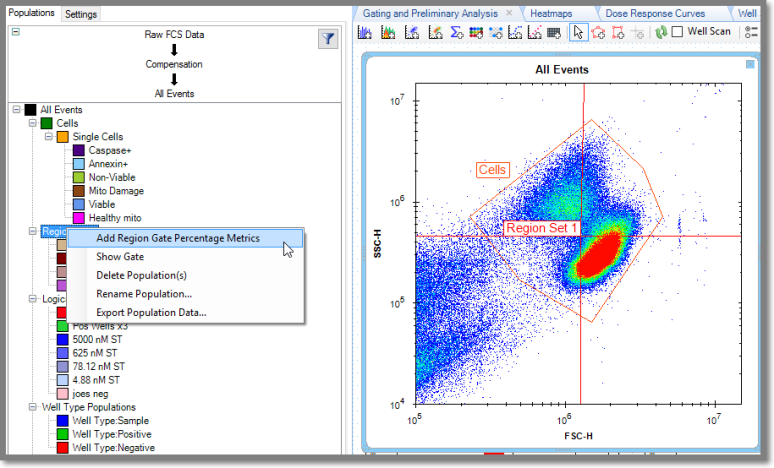
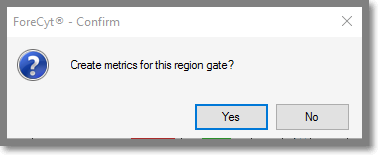
The Add Region Gate Percentage Metrics option is enabled when your right-click on a Region Set. You will be asked if you want to add metrics.
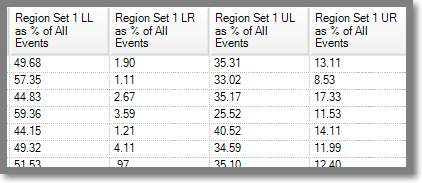
As shown in the following screenshot, ForeCyt automatically adds fields in the Metrics tab for each quadrant of the region gate. (LL = Lower Left, LR = Lower Right, UL = Upper Left, UR = Upper Right.)
Clicking on Show Gate displays the gate with default scaling and percentage of events in each quadrant.
You can shift-click on consecutive populations or control-click non-consecutive populations and then right-click to bring up the additional menu options.