|
iQue Forecyt® Reference Guide (Version 9.0)
|
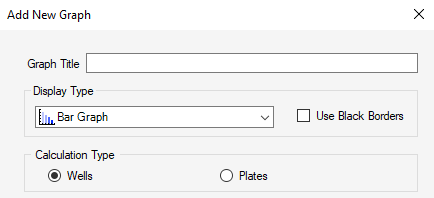
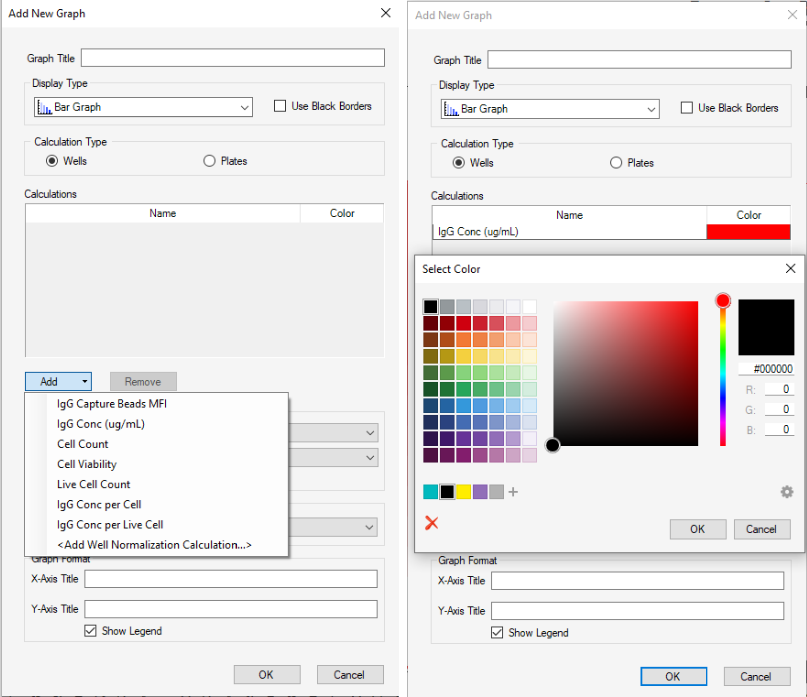
Add New Graph
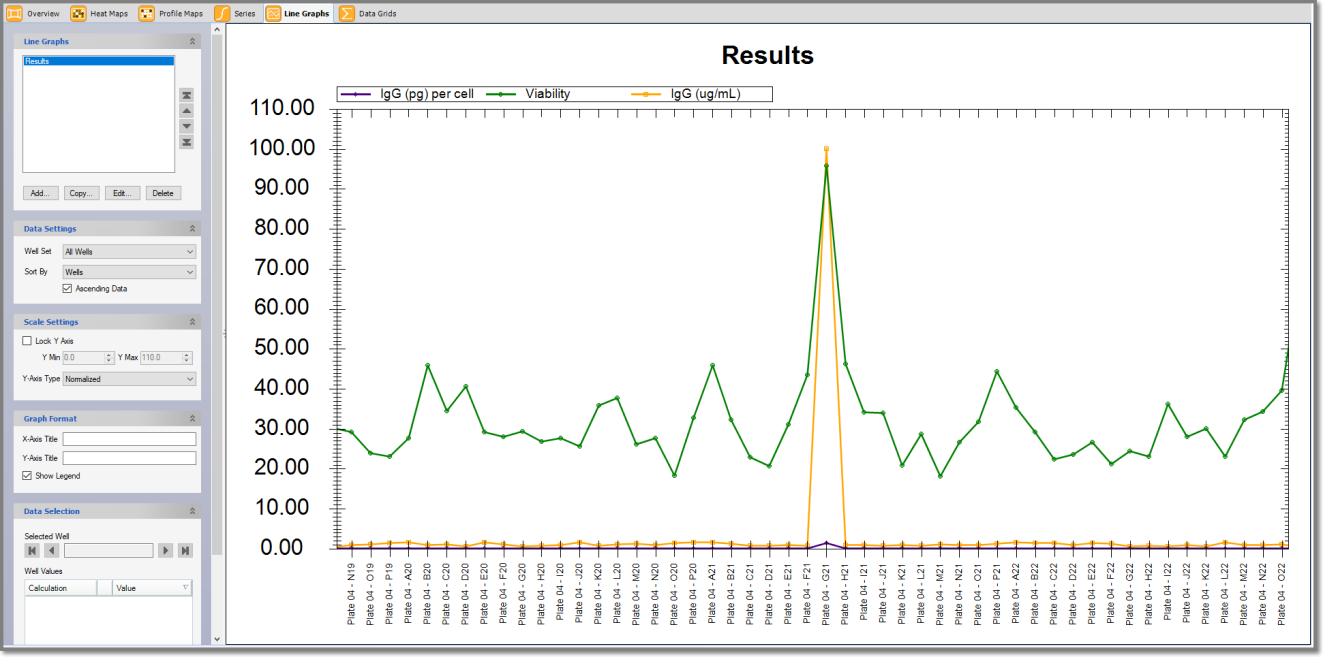
The Add New Graph dialog box sets up all the parameters for a Panorama line or bar graphs, as shown under the Display Type.
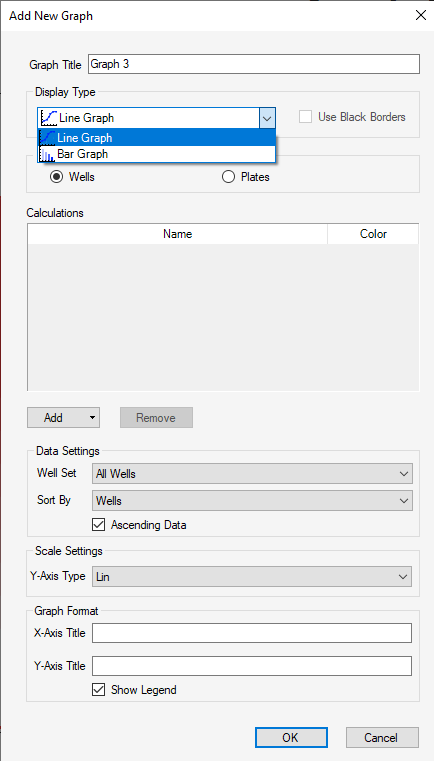
Graph Title
The Graph Title is displayed at the top of the graph. The title must be unique within the graph set for a particular Panorama. You cannot have an untitled Graph. The Display Type combobox specifies the type of graph to display. If the Bar Graphs option is selected, the Use Black Borders option is available. Checking the Use Black Borders checkbox will draw black borders around the bars.
Click the Calculation Type radio button to specify Wells or Plates data for the Graph.
Calculations
Add the Metrics you will use to build your Graph by clicking Add and selecting them from the drop-down menu. As they are added to the Calculations list, they are removed from the drop-down. Each metric is assigned a color as you select it. You can change the color by clicking at the end of the row to activate a pop-up menu with colors and the ability to add custom colors. It's a good practice to have very distinct colors for your graph.
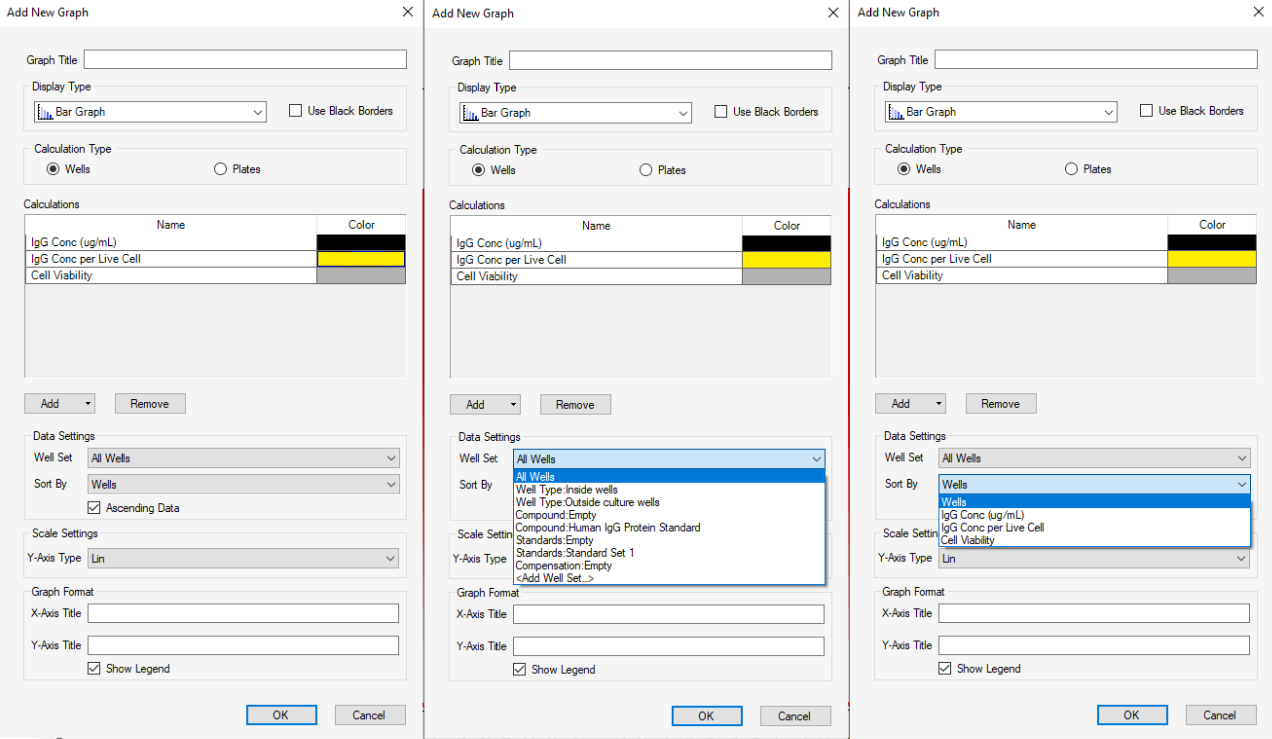
Data Settings
Data Settings is where you specify Well Set and Sort by. Check the check box for Ascending Data order. As shown in the following screenshot there are drop-down menus that list the available data settings.
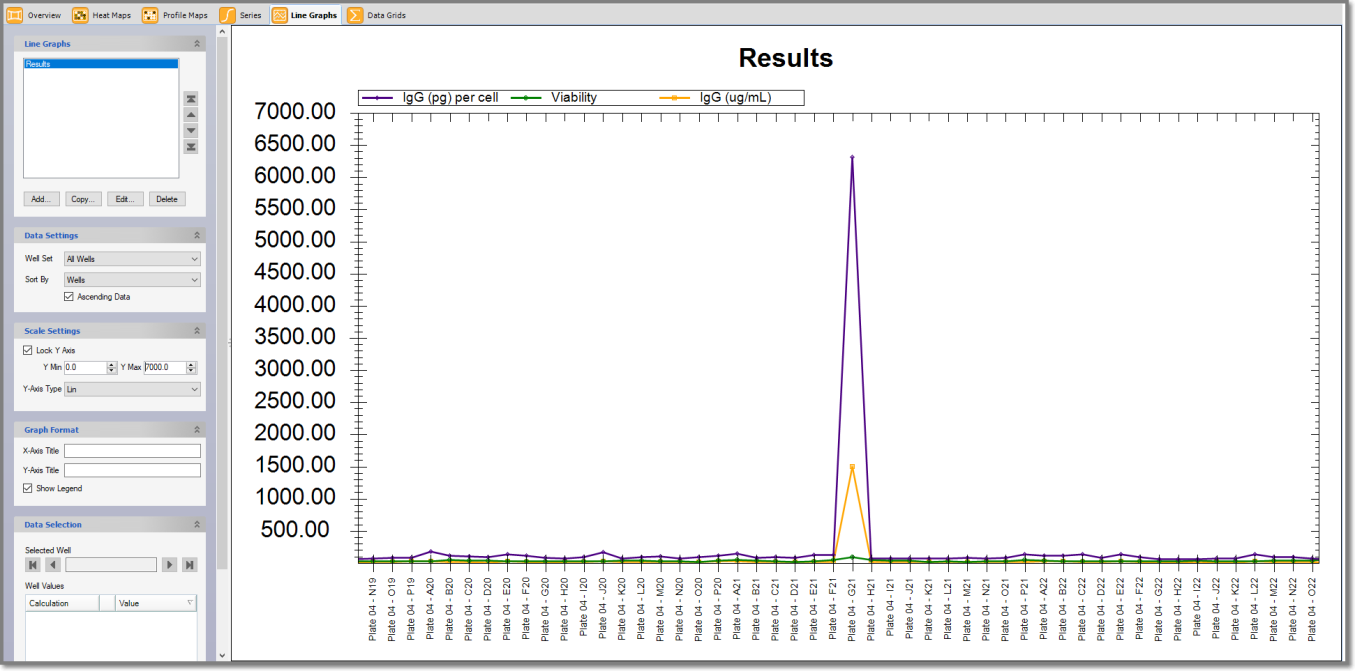
Scale Settings
Scale Settings is where you specify how you want your Graph data displayed. By default the Y axis is checked and it's a good idea to keep it that way. You can also specify the Y Min and Max to narrow down the number of events.
Scale Settings: Linear
Linear Scale can display hard-to-see trends on inputs that vary by orders of magnitude as shown in the following screenshot.
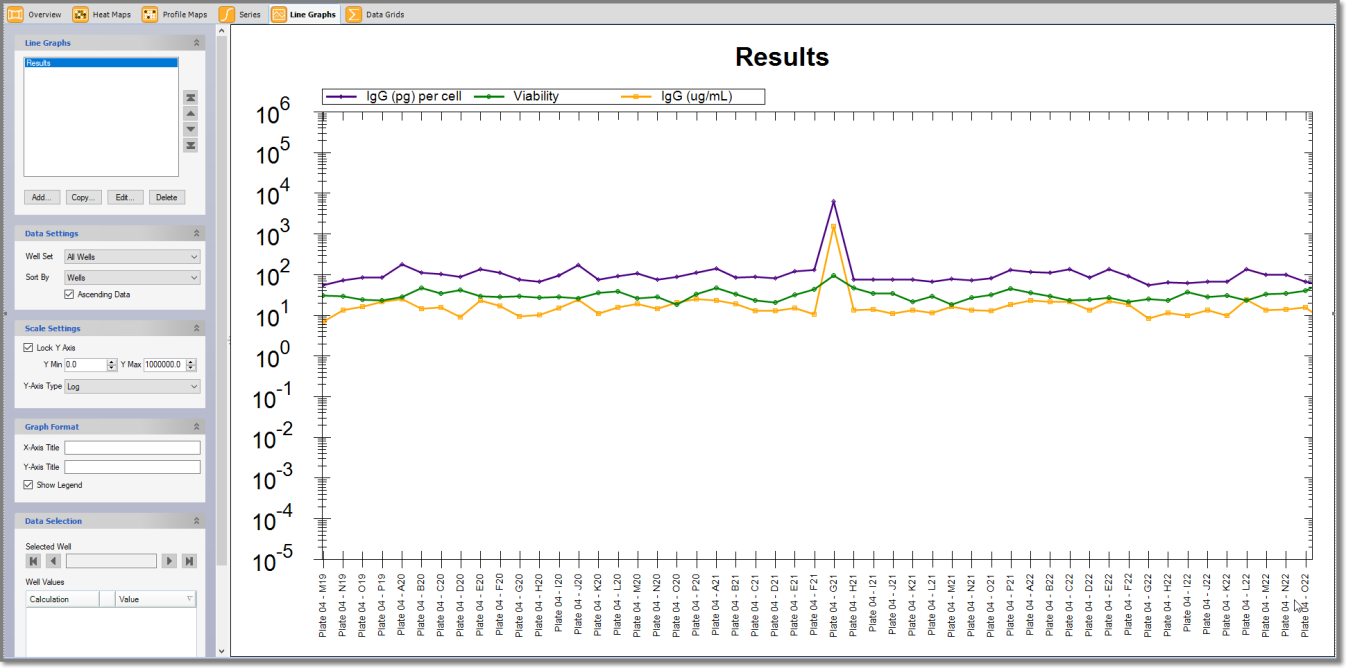
Scale Settings: Log
Log Scale displays a variation of inputs that have a narrow range, as shown in the following screenshot.
Scale Settings: Normalized
Normalized Scale emphasizes the variation of each input with respect to other inputs.
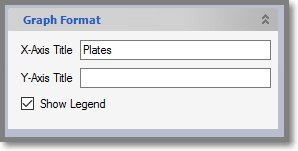
Graph Format
Graph Format is where you can label the X and Y axis of your graph.