|
iQue Forecyt® Reference Guide (Version 9.0)
|
Contour Plot
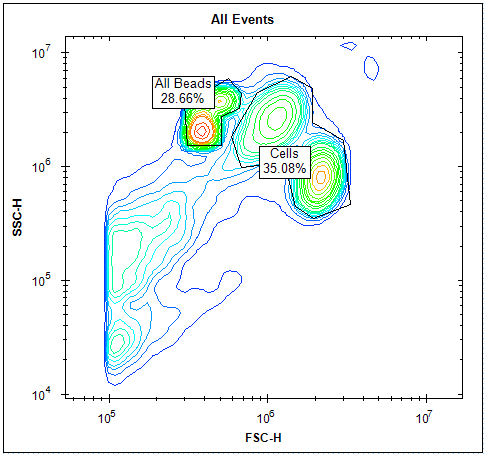
A contour plot is a graphical technique for rendering 3-dimensonal surface by plotting constant z slices, called contours, in a 2-dimensional format

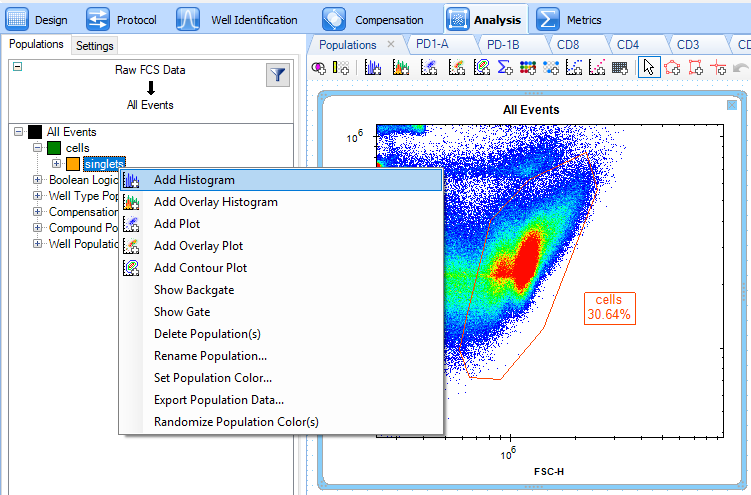
When you are in the analysis tab and open a default All Events plot, you may then right click and select the Add Contour Plot icon in the dropdown.
As shown in the following screen shot, two previously gated populations named All Beads and Cells are now displayed as a . The contour plot clearly displays two distinct cell populations in the All Beads and Cells populations.
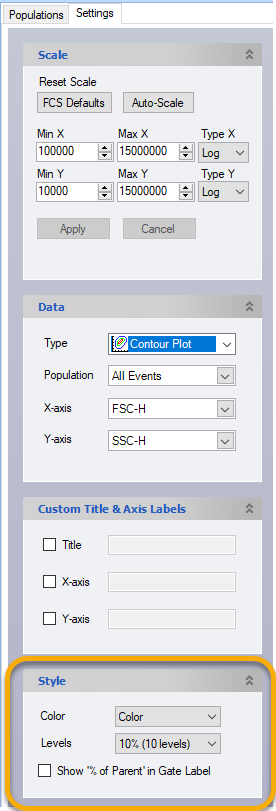
Style (Contour Plot)
If necessary, you can disable the contour plot display by altering the colors and percent of the cell levels by viewing the settings tab and searching for the Style sidebar. The Style sidebar allows you to adjust the color combo box to black or color with a dropdown menu and the Levels combo box has options for: “10% (10 levels)”, “5% (20 levels)”, or “2% (50 levels)”. Each option divides the 2D plot’s Z data, i.e., the event count at each X, Y point, and divides all visible events into the selected Levels option percentages.