|
iQue Forecyt® Reference Guide (Version 9.0)
|
Analysis Sidebar: Settings
When you first click on the Settings sidebar tab the sidebar area is blank, as shown in the following screenshot.
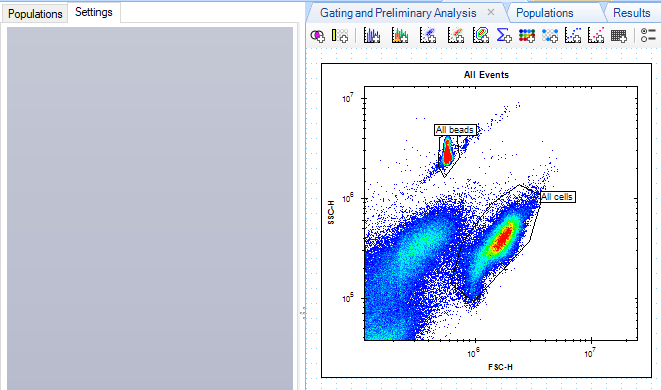
The sidebar is not enabled until you select an analysis in the workspace. There are multiple Settings sidebar menus contextually related to specific analyses. When you have a histogram or plot selected, there are five Settings panes: Scale, Data, Title and Axes Labels, Type, Style, Well Scan, Label Sizes.
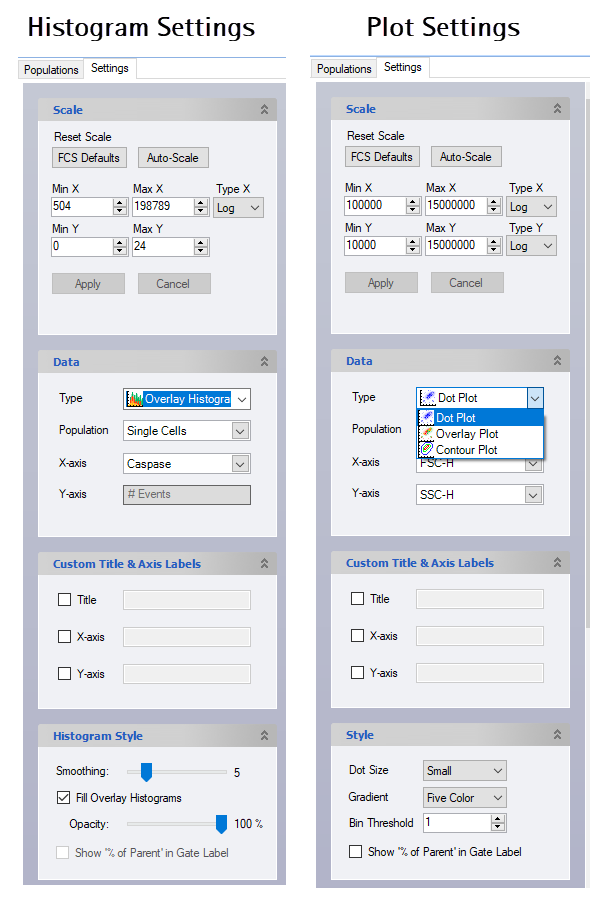
Scale
Scale allows you to change axes, either by typing in a value or using the up and down arrows. You can change the Type from Log to Lin. If it is a fluorescent channel you can also change it to biexponential.
Data
Data allows you to change the display of a Histogram or Plot. Histogram types can be Histogram or Overlay Histogram. Plot types can be Dot Plot, Overlay Plot, or Contour Plot. It allows you to select the population of interest.
Custom Title and Axis Labels
Custom Title and Axis Labels allows you to add, change or remove titles and labels for graphs and plots.
Histogram/ Style
Histogram Style function allows you to change the apperance of your data plot. Histograms can be smoothed and Overlay Histogram applied. Plot types can be Dot Plot, Overlay Plot, or Contour Plot.
Well Scan
Well Scan allows you to visualize data from individual wells.
Label Sizes
Label Size allows you to change settings for axis labels, title, legend properties and related content for plots and histograms.
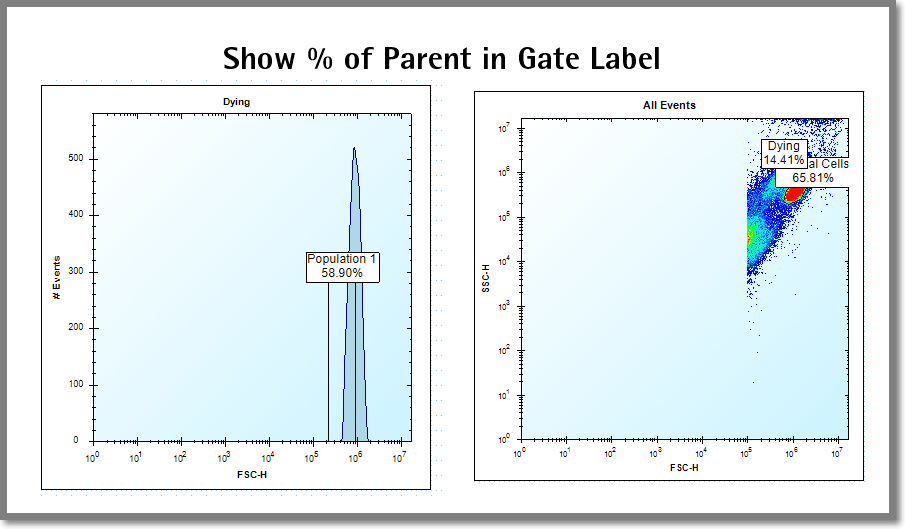
Show Percentage of Parent
This gate label displays the percent of the parent population contained in the gate. You can toggle it on or off with the check box. The following screenshot shows and example of Show % of Parent on a Histogram and Plot.