|
iQue Forecyt® Reference Guide (Version 9.0)
|
Scale: Dose Response
Scale allows you to make axis adjustments to the selected Series. As shown in the screenshot below, Lock Y Axis is unchecked by default. The selected Series will auto-scale the Y Axis to the specified values. When the Y Axis is not locked, the scale of the Y Axis is based on the actual data range of the plotted metric. If the minimum observed value is greater than, or equal to zero, the min scale is set to zero. Otherwise, the min scale is set to the min observed value. If the maximum observed value is greater than or equal to zero, the max scale is set to max observed + 10% padding. Otherwise, the max scale is set to 0.
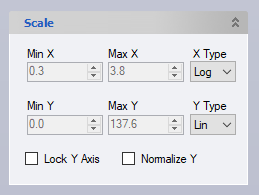
As shown in the following screenshot, if you check Lock Y Axis, the Min and Max fields are enabled and you can specify a Y axis range. If you lock the Y Axis scale, the Y min and Y max are taken from values specified in the drop-down, or values you type in. The Y Axis title is the name of the plotted metric. The X Axis is log concentration is the title of the X axis on the plot.

As shown below, you may also choose to check the normalize Y option to normalize your Y axis to 100.0.
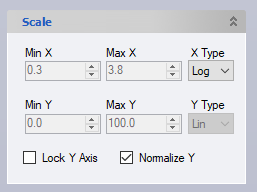
The normalize Y feature will be automatically generated when there are a mixture of absolute and percentage metrics.
