|
iQue Forecyt® Reference Guide (Version 9.0)
|
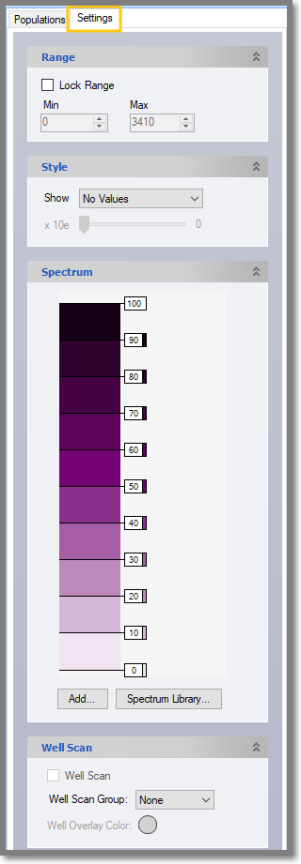
Settings: Heat Map
The Settings sidebar tab for Heat Maps provides a number of options for how you can visually represent data in a Heat Map.
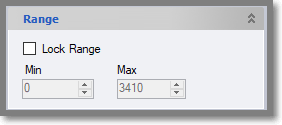
Range: Heat Map
You can control the range of data displayed in the Heat Map with this function. You can Lock Range and either use the up and down arrows or type in a value.