|
iQue Forecyt® Reference Guide (Version 9.0)
|
Show Curve Fit
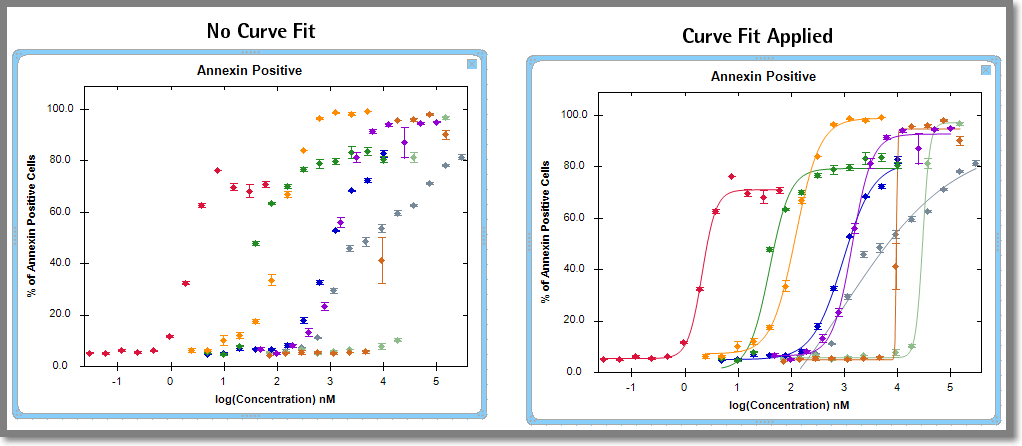
The following screenshots show Dose Response curves without and with Curve Fit applied.
Show Fit Properties
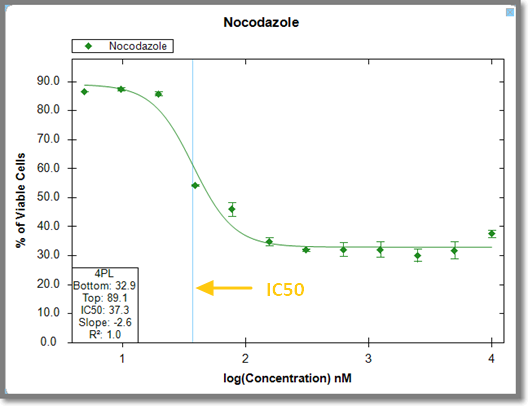
Show Fit Properties is dimmed if there are multiple series on a graph. If you have a graph with just one series, clicking on Show Fit Properties displays the Bottom, Top, EC/IC50, Slope and R2 of the fitted curve in the lower right for EC50 as shown in the following screen shot.
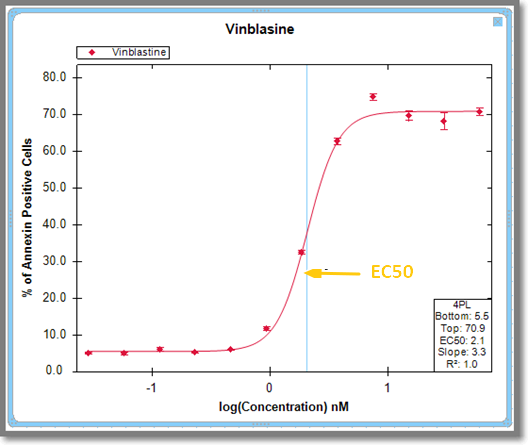
The Fit Properties are shown in the lower left for IC50 curves. In either instance, there is a light blue line at the EC/IC50 point on the Series.