|
iQue Forecyt® Reference Guide (Version 9.0)
|
Style: Heat Map
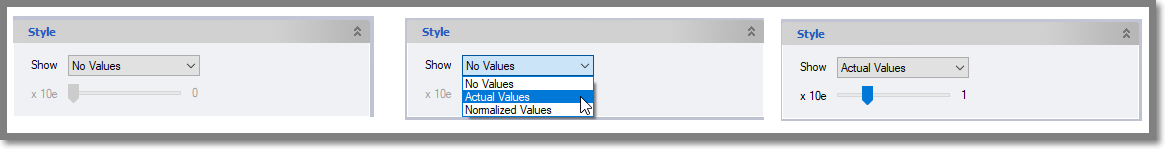
The following screenshot shows the process for changing the Style of how your data is displayed on the Heat Map. The slider moves the decimal so you can see a large number. For example, 100,000. If you increase from default 0 to 3. Then 100 will be shown in the heat map.
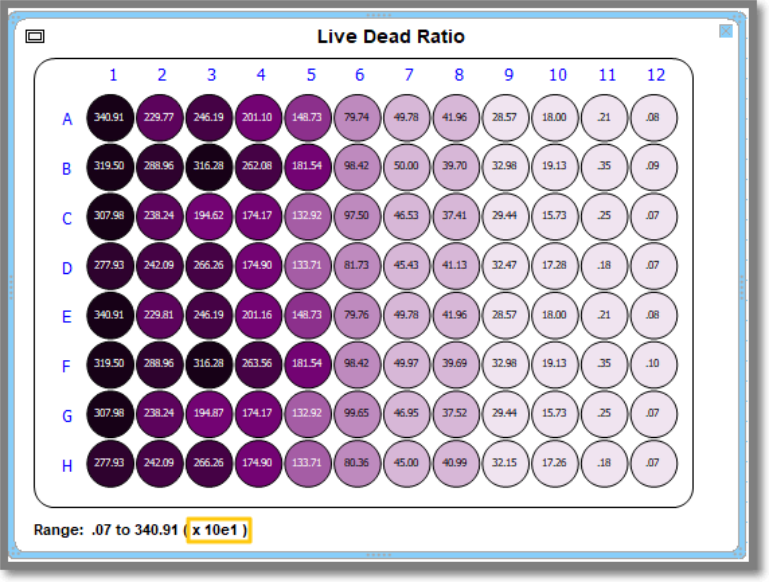
The following screenshot shows how the legend at the bottom of the Heat Map updates to reflect the change in Style when the slider moved from x10e to x10e1.