|
iQue Forecyt® Reference Guide (Version 9.0)
|
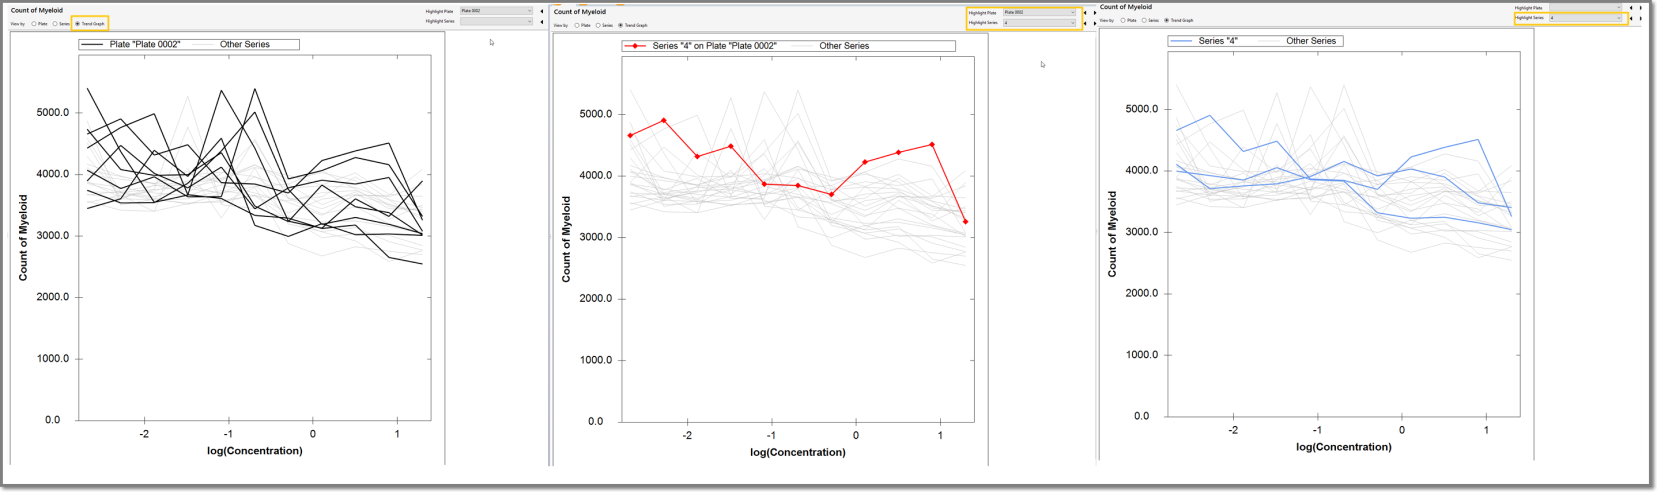
View by Trend Graph
As shown in the following screenshot, View by Trend Graph displays dim gray plot lines with black lines for Highlight Plate. When Highlight Plate and Series are selected, then a single red curve will appear denoting that plate and series. Selecting only Highlight Series displays a blue plot line.