|
iQue Forecyt® Reference Guide (Version 9.0)
|
Well Scan

The Well Scan pane is enabled each time you select a plot or histogram. By default, the 1D histograms and 2D plots you create in Analysis show data from every well on the plate. Well Scan provides a well-by-well view of this data. You can scan all the wells or jump to a specific well of interest. Well Scan is very useful for multiplex assays because it provides a visual well-by-well profile of multiple markers. You can also use Well Scan to compare positive and negative controls.
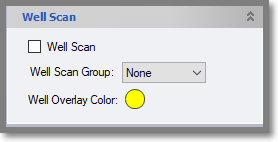
This the Well Scan options sidebar pane .
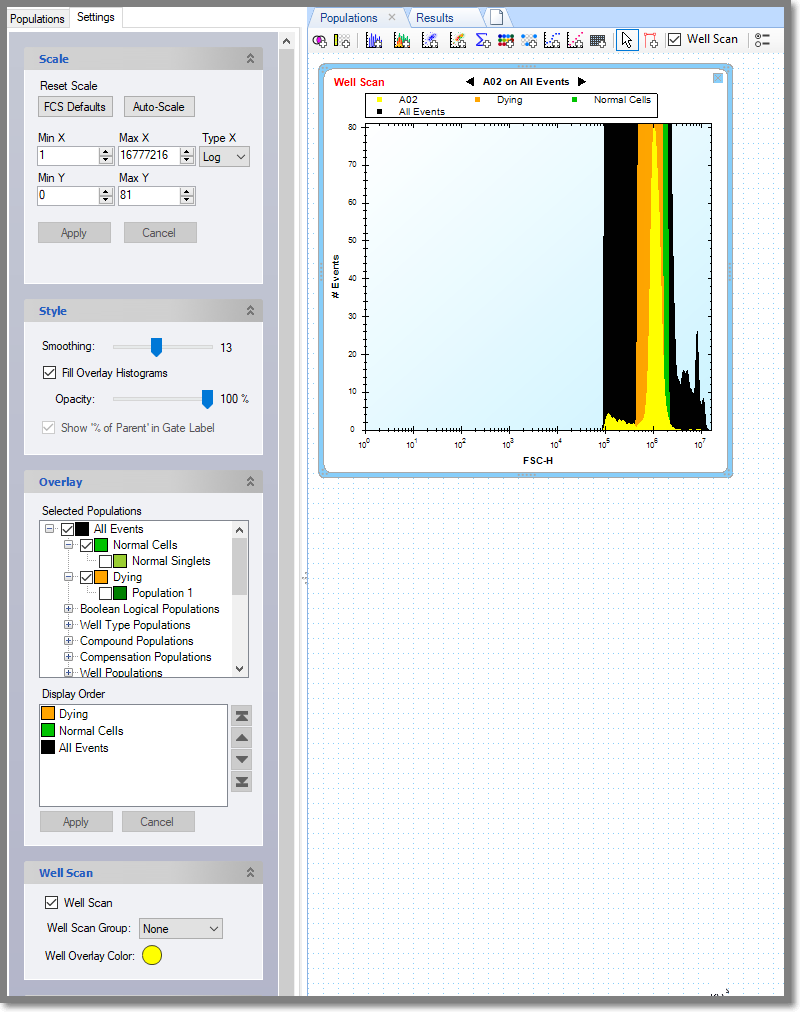
The following screenshot shows Well Scan enabled and displaying Well A02. The Display Order is Dying, Normal and All Events with the Well Scan well overlaid.
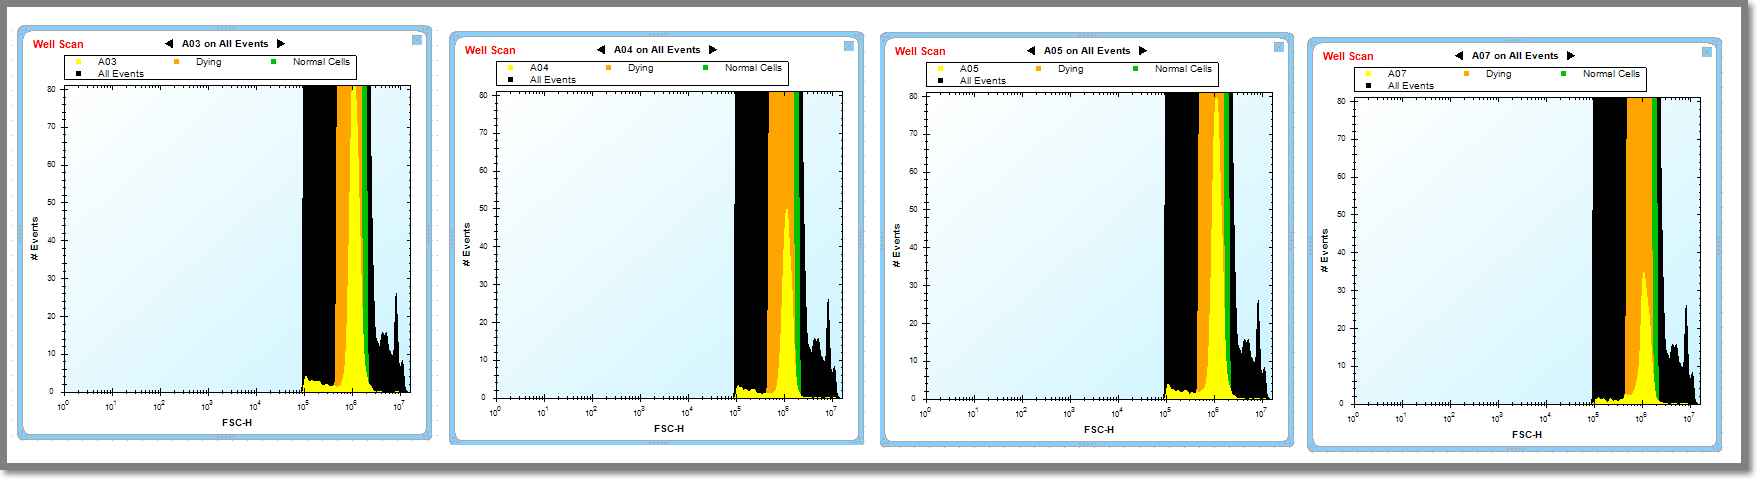
In the following example you can see how the Well Scan overlay changes from well to well.
Well Scan Group
You can assign multiple analysis items to a Well Scan Group and they will display the same target well. Changing the target well on any of the items in the group with cause the rest of the analysis items to switch to that well. The following items support well scan group: Histograms, Overlay Histograms, Plots, Overlay Plots, Heat Maps, Profile Maps and plate views. To assign an item or items to a well scan group, select the items, check mark the well scan mode and select the group to which you want the item to be assigned. If well scan check box is unchecked for item in a group, the item remembers the group it was previously assigned, switching it to None will remove it from that group permanently.
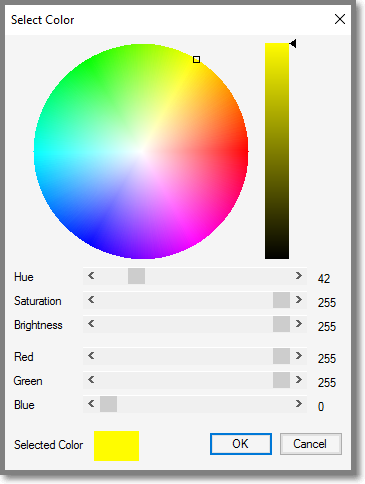
Well Overlay Color
You can assign a Well Overlay Color that can help distinguish the well of interest. The default is yellow. When you click the Well Overlay Color the Select Color wheel opens. It's a good idea to specify a bright color for Well Scan to help distinguish it.