
|
iQue Forecyt® Reference Guide (Version 9.0)
|
Introduction
iQue Forecyt® is the powerful integrated software platform that both controls your instrument and provides experiment creation and analytic functions. This reference guide describes iQue Forecyt® functions and capabilities. If you have an earlier version of iQue Forecyt® there might be differences in some of the screenshots in this guide compared with your version. However, the vast majority of this guide is applicable to earlier versions of iQue Forecyt®. While we included some “how-to” information, it is not a tutorial of how to use iQue Forecyt®; it is a resource intended to be referenced when you want to learn about specific features and functions rather than a manual you might read beginning to end.
Expand the headings in the sidebar to see all the subheadings and click on topics of interest. There is a topic for every iQue Forecyt® function. Or, use the search bar to find information about any aspect of iQue Forecyt®.
Overview of the iQue Forecyt® Screen
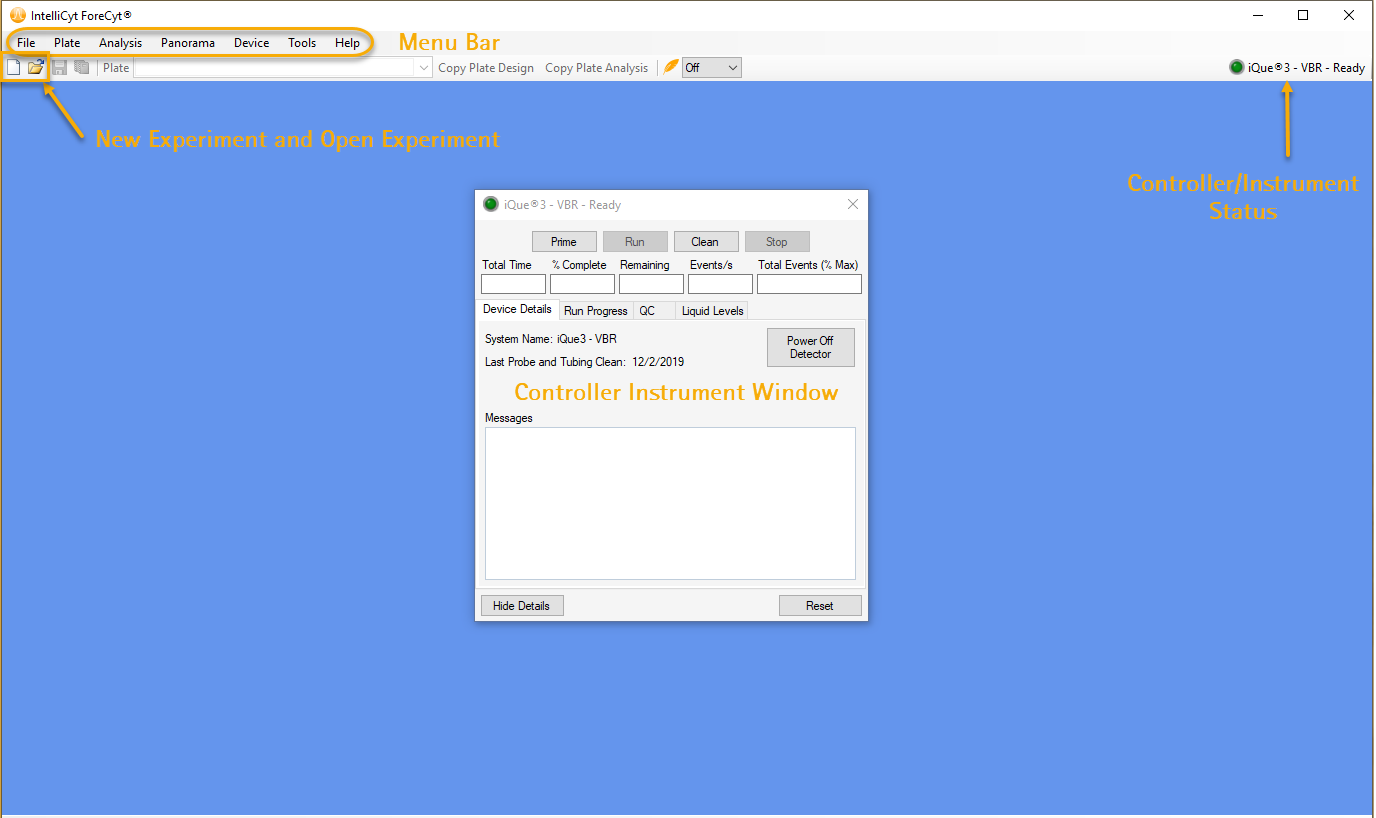
The following screenshot shows what you'll see when you first open iQue Forecyt®. You can close the Controller Tool Window when you're not using it by clicking the X. Clicking on the green Controller/Instrument Status button opens it again.
iQue Forecyt® Screen on Open
When you click on the New Experiment icon a window opens that lists all previous experiments (if any). At the bottom of the screen is a window where you will name the experiment and click Save.
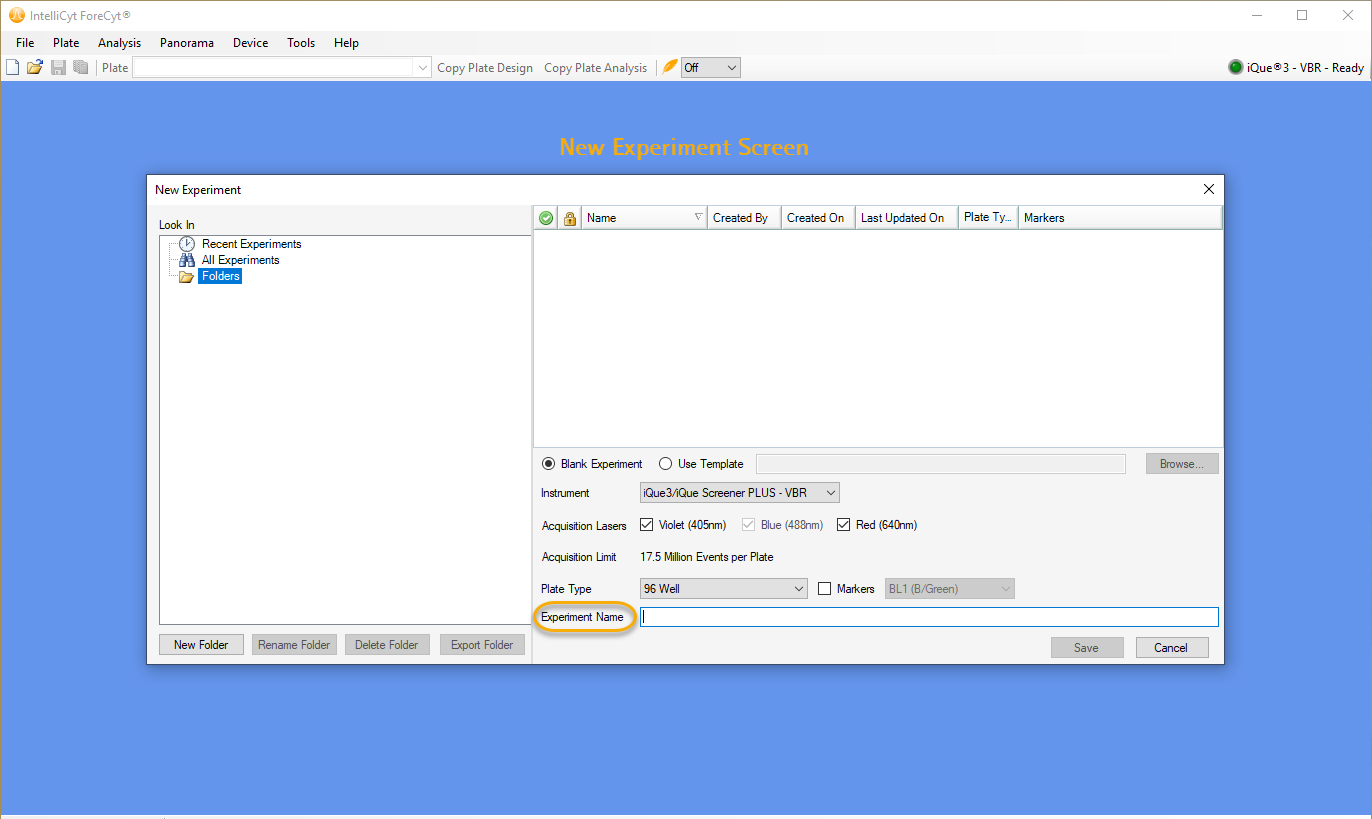
Initial Experiment Screen
iQue Forecyt® Tool Tab Descriptions

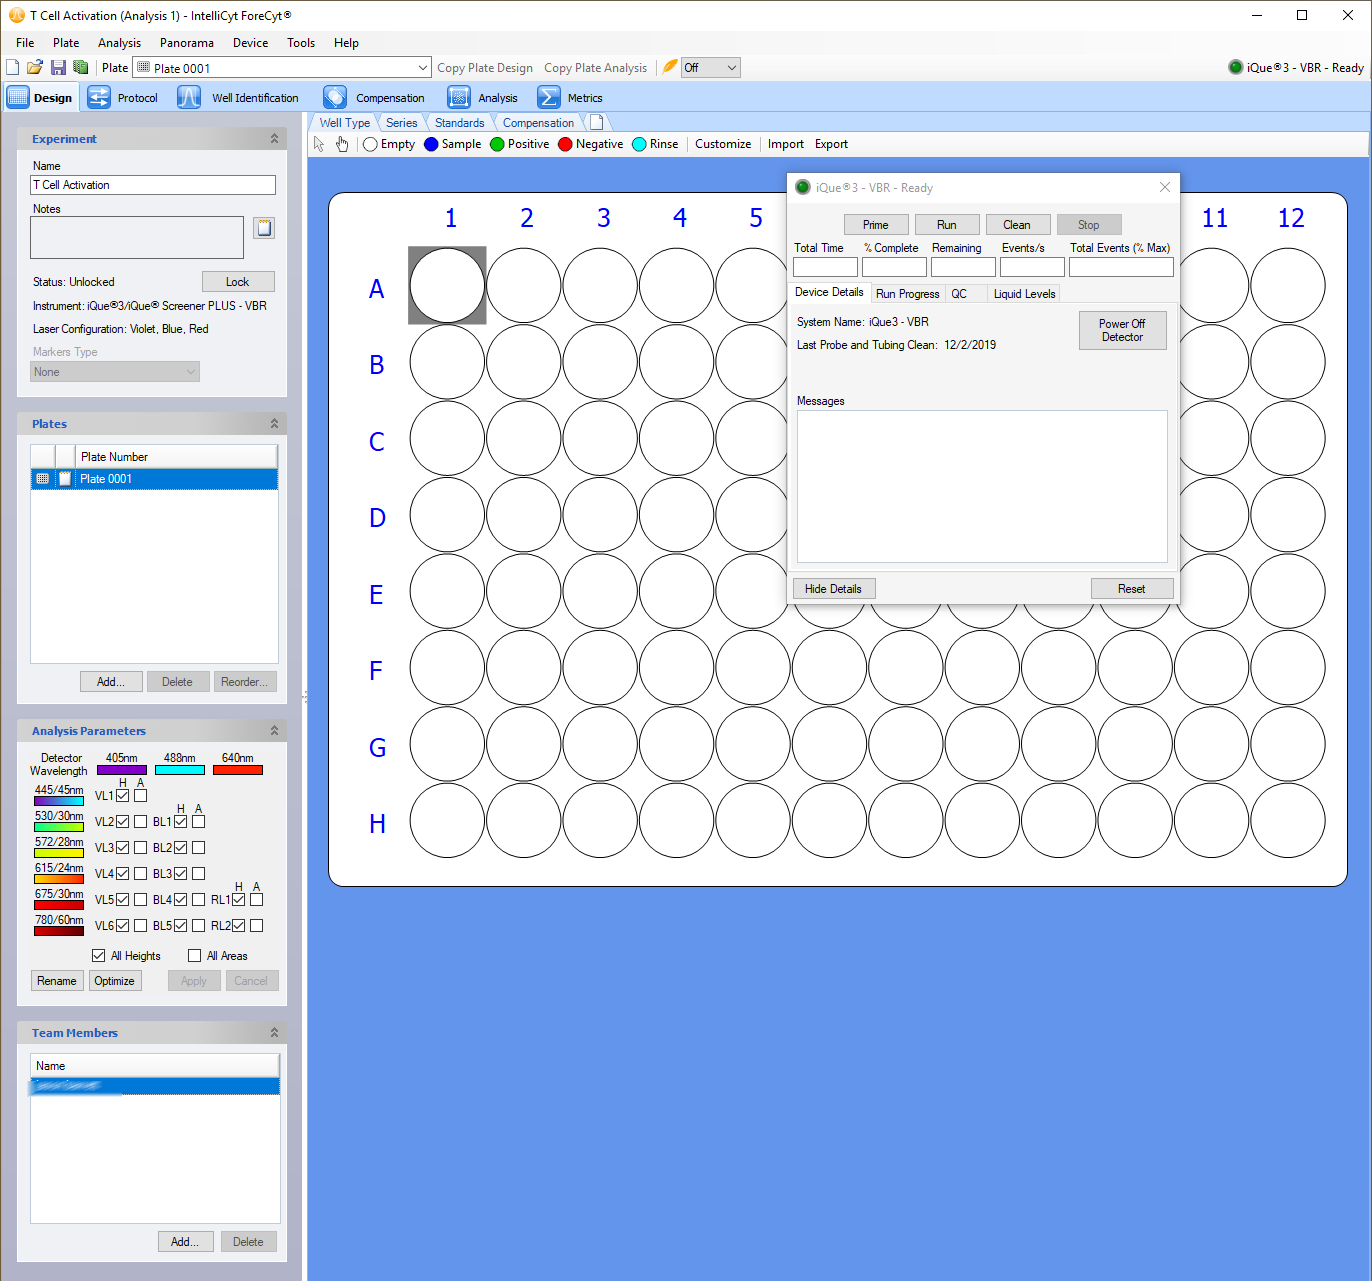
The Design tab is where you’ll set up many parameters of your experiment including adding plates to your experiment, specifying well contents, analysis parameters, and team members associated with the experiment.

The Protocol tab is where you set iQue®parameters for acquiring samples in your experiment such as Sip Time, Sample Order, Shaking and Cleaning.
Well Identification is the process by which iQue Forecyt® parses the data generated from sampling your plate and determines which sections of the data correspond to samples taken from specific wells of a plate.

Analysis is the powerful iQue Forecyt® feature that provides simple-to-complex data visualization and analyses and lets you interrogate your data from multiple perspectives.

Metrics are how you organize the statistical values associated with your experiment and convert the graphical representations of gates and populations into raw or calculated numerical data.