|
iQue Forecyt® Reference Guide (Version 9.0)
|
Overlay Plot
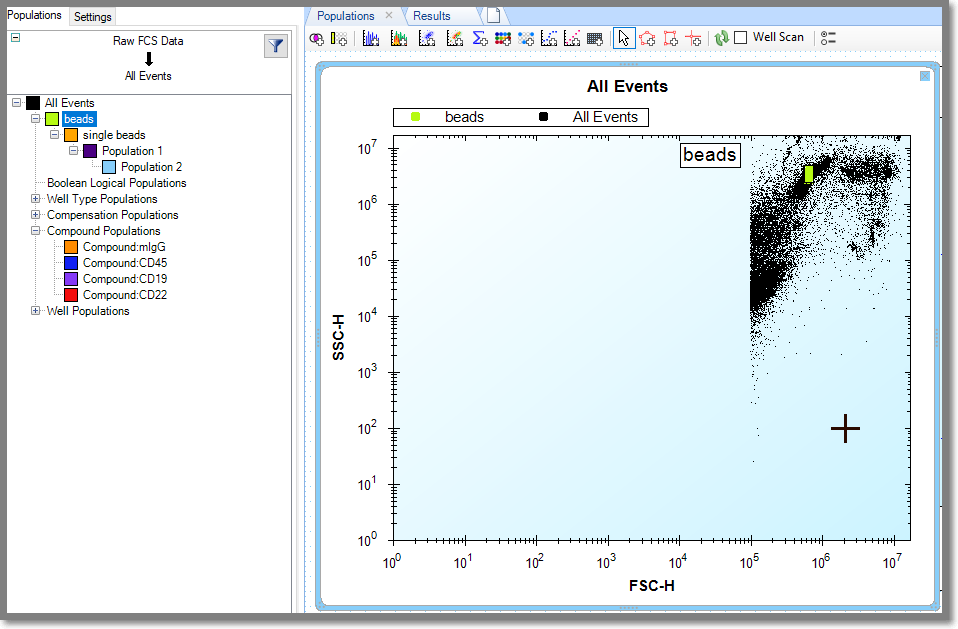
 When you click the Add Overlay Plot icon in the tool bar a default All Events plot opens. As shown in the following screen shot, we gated the Beads, making the two populations All Events and Beads.
Display Order: Overlay Plot
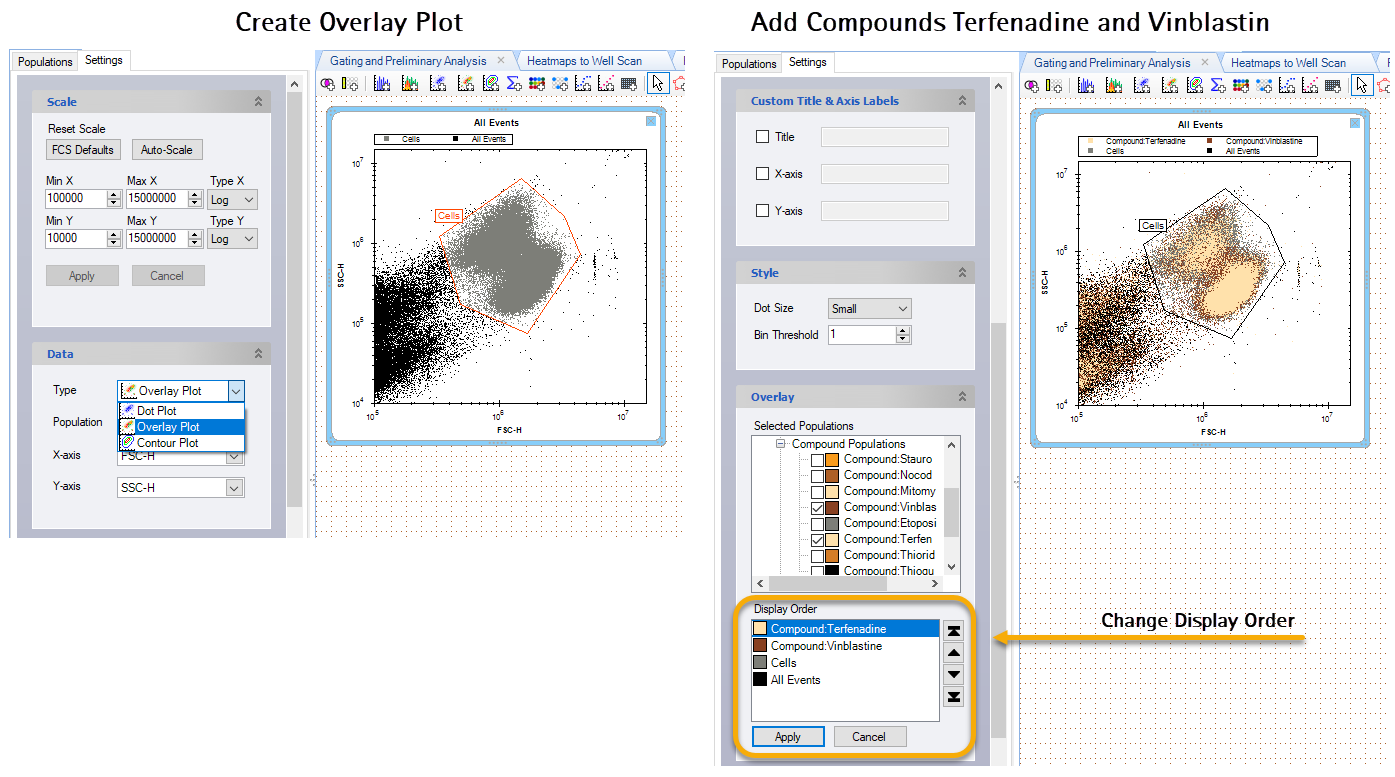
In the following screenshot we dragged the Terfenadine and Vinblastin populations to the Overlay Plot. It was hard to see so we switched to Settings in the sidebar and changed the Display Order by selecting Terfenadine and clicking on the up arrow to move it. This changed plot representation as shown in the following screenshot. The Plot does not update in real-time, you have to click Apply.
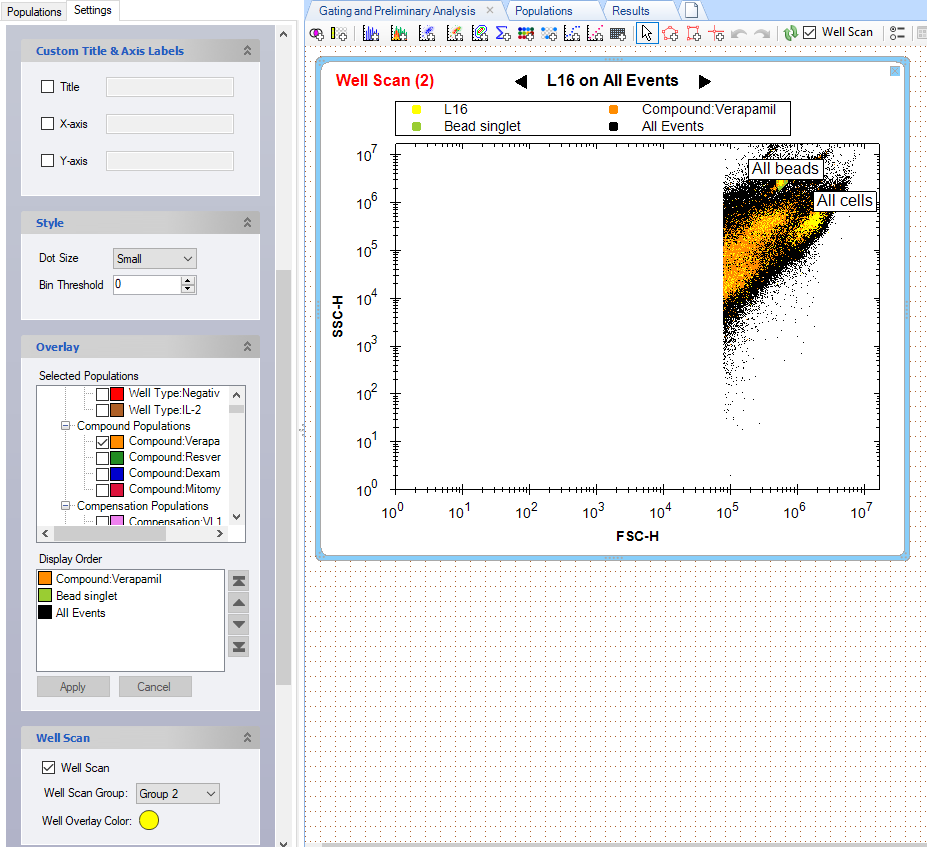
Well Scan (Overlay Plot)
It is helpful to specify a bright Well Overlay Color in the Well Scan pane to help you distinguish the well population. In the following screenshot the Well Overlay color is yellow, the default. It shows the population of well L16.